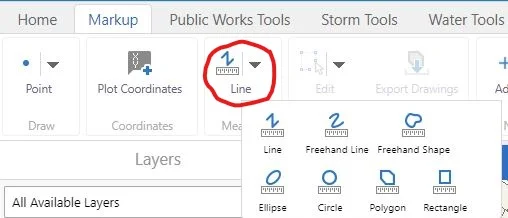
Today we will be going over the measuring tool. First, we want to choose a form of measurement. In this case, we will choose a polygon. The snapping feature allows for more accuracy in measurement. As you may notice in the screen shot below, we are also able to change our units of measurement by simply clicking on the drop down lists next to them.
Mapping Pearl Harbor
December 7th is recognized as National Pearl Harbor Remembrance Day in the United States, which took place 76 years ago on this date. If you click on the image below you will be linked to an in depth and engaging story map (via Esri). The story map utilizes pictures, videos, and maps in order to retell the complex events that took place at Pearl Harbor.
Right-Click Menu
Mapping Thanksgiving!
Mapping Snow Plow Routes with GIS
Using GIS Technology in Animal Shelters
October is recognized as national "adopt a shelter dog" month. Not surprisingly, GIS technology is being employed to help lower the population of pups in shelters. GIS can be utilized for mapping locations of animals. It lets users observe various data sets in a manner which provides greater insight into their community's animals and their needs; that allows for a more productive use of resources.
CCTV-Video Linked to Pipe
National Fire Prevention Week
As this week is National Fire Prevention Week, we will take a look into how GIS technology is providing awareness and safety to the communities in Northern California that are currently being ravished by deadly wildfires. As mentioned in our previous post about Hurricane Harvey and Irma, GIS not only provides the general public with crucial information in disaster situations, but it also allows first responders and policy makers to work more efficiently. By clicking on the image below, you are able to view Esri's US Wildfire Activity Web Map.
Cemetery Tool
The Cemetery Records tool is a specialty tool we offer as part of our GIS services. This tool is tailored to fit your data. Despite the rather grim topic, a Cemetery Records map can be quite efficient when made available to the public. For example, if a community member calls your municipality in search of a genealogy report, you can guide them to the cemetery map; this way, they are able to pull up the information they desire on their own.
World Teachers' Day - Incorporating GIS
Most people have had at least one teacher that has made a positive and lasting influence in their life. Today is recognized as World Teachers' Day. Thank you to all the hardworking teachers out there! Let's take a look at the unique and innovative manners in which teachers have incorporated GIS into their lesson plans. Esri documents inspiring ways teachers are Advancing STEM Education with GIS.
Add, Subtract, and Save Results
Today we will be discussing the "Add/Subtract" results tool. In this example, we will be generating a mailing list to notify property owners of upcoming road construction that will be happening in their area. First, we will use the identify tool to select our general area(s) of interest. In this instance, it is best to use "identify by line" because we would like to select multiple parcels in a row along the same street.
Fall Shore Fishing
Fall Foliage Prediction Maps
September 22, 2017 is the astronomical start of fall here in the Northern Hemisphere! The interactive map below (click on image to link to website) has been produced to forecast peak leaf colors each year. The map compiles National Weather Service data on historical temperatures, forecast temperatures, and forecast precipitation, as well as historical leaf peak and peak observation trends in order to make the most accurate predictions.
Create and Save a Filter
Using the filter tool is a great way to sort anything in your GIS application that requires routine maintenance (i.e. valves, trees). A filter presents a focused view of a feature layer in a map. By limiting the visibility of features in a layer, you can reveal what's important. To begin, we click on the filter button on our toolbar.
Esri Story Maps - Hurricane Harvey and Irma
Use the Markup Tool to Add Images
One of the more recent features that have been added to your GIS applications allows you the ability to add an image for a new point (or points) on the map, using the markup tool. What does this mean? Well, we'll show you! First, you will want to go under "Markup" in your viewer and choose the point option.
GIS and Wildlife Management
On September 7, 1936 the last thylacine (Thylacinus cynocephalus aka Tasmanian tiger/wolf) died at the Hobart Zoo in Tasmania. Fifty years later the entire species was declared extinct. Today is remembered in Australia as "National Threatened Species Day." In more recent times, throughout the world, many humans understand and value the importance of biodiversity and protecting wildlife.How has GIS contributed to wildlife management and protection?
Customizing Labels
The Geography of the NFL
Did you know that the Green Bay Packers, who joined the APFA in 1921 just before the name change, are the only current team in the history of NFL who have maintained their name and location for its duration? View these maps of the history of the NFL and if the NFL divisions if they were to be based purely on geography.