
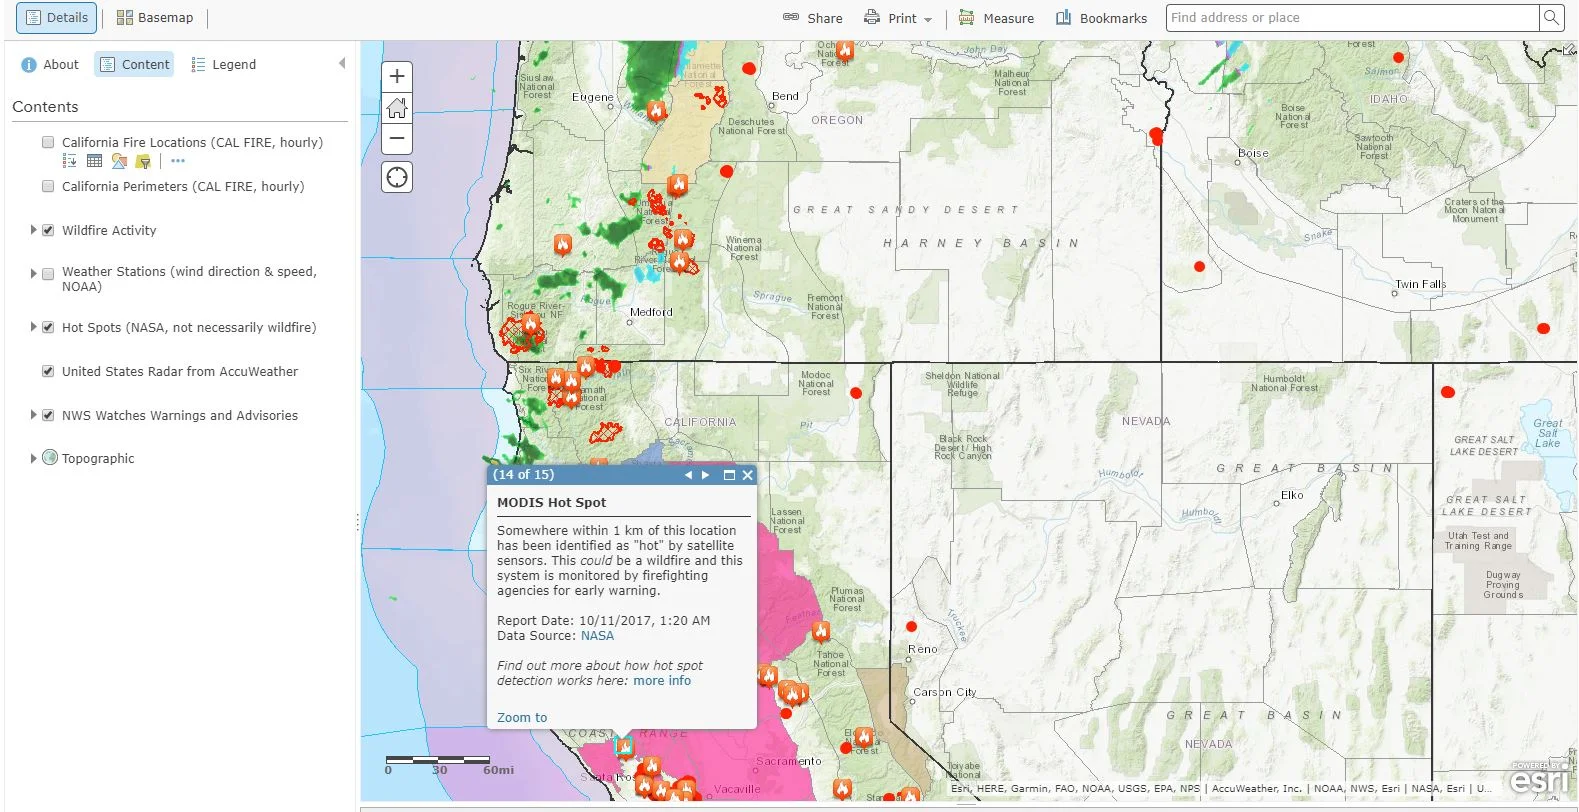
As this week is National Fire Prevention Week, we will take a look into how GIS technology is providing awareness and safety to the communities in Northern California that are currently being ravished by deadly wildfires. As mentioned in our previous post about Hurricane Harvey and Irma, GIS not only provides the general public with crucial information in disaster situations, but it also allows first responders and policy makers to work more efficiently. By clicking on the image below, you are able to view Esri's US Wildfire Activity Web Map.

The content offered via the interactive map is extensive. The layer data ranges from the location of individual fires, wind direction and speed (NOAA), hot spots detected (NASA), National Weather Service warnings and advisories, etc. The sub-layers include information such as "Events Ordered by Size and Severity." There are options to view data in a table format, change the map/layer style, and filter information.
Clicking on the location/activity icons within the map provide details about when a fire first began, how many acres it spans, the percentage that the fire has been contained, and so on.
In cases of wildfire, various officials can incorporate fire perimeter data with near real-time satellite hot spot detection to deliver a realistic depiction of fire progression. Real-time weather (wind) can be merged to provide suggestion of the speed and direction a fire would travel. When combined with GIS layers that can detect homes and other establishments, the data provides fire officials with improved information to make strategic and defensive choices regarding public safety, resource distribution, evacuation demands, and further equipment necessary.
