geography

National Boy Scout Day - Incorporating GIS into Activities

National Boy Scout Day - Incorporating GIS into Activities

Today is recognized as National Boy Scout Day, with the official birthday being February 8th, 1910. That is a long time! Using a paper map and compass are valuable and essential skills taught to Boy Scouts. However, we thought it would be interesting to explore some ways in which GIS has been incorporated into scouting activities. Fun fact: The Boy Scouts (and Girl Scouts!) offer badges that tie into GIS, such as geocaching and surveying.

Mapping the Winter Solstice

Mapping the Winter Solstice

Well, it is officially winter! The time and date of the solstice change ever so slightly by year, but this year’s solstice occurs at 11:28 a.m. Eastern Time. The winter solstice marks the shortest period of daylight in the Northern Hemisphere. However, today is not the day of the latest sunrise or earliest sunset. Rather, most areas within mid-latitudes witness the earliest sunset two weeks prior to the solstice, while the latest sunrise does not occur until the beginning of January!

Mapping Pearl Harbor

Mapping Pearl Harbor

December 7th is recognized as National Pearl Harbor Remembrance Day in the United States, which took place 76 years ago on this date. If you click on the image below you will be linked to an in depth and engaging story map (via Esri). The story map utilizes pictures, videos, and maps in order to retell the complex events that took place at Pearl Harbor.

National Fire Prevention Week

National Fire Prevention Week

As this week is National Fire Prevention Week, we will take a look into how GIS technology is providing awareness and safety to the communities in Northern California that are currently being ravished by deadly wildfires. As mentioned in our previous post about Hurricane Harvey and Irma, GIS not only provides the general public with crucial information in disaster situations, but it also allows first responders and policy makers to work more efficiently. By clicking on the image below, you are able to view Esri's US Wildfire Activity Web Map.

Mapping Beer!

Mapping Beer!

Today is recognized as National Refreshment Day! Seeing as beer has been a rich part of Wisconsin culture and history, why not explore a creative approach that has been taken in the mapping of beer! First, here is an interesting read by Andrew Shears, Local to National and Back Again: Beer, Wisconsin, and Scale, a chapter in his book "The Geography of Beer."

Table View vs. List View

Table View vs. List View

When identifying features, you have the ability to view your data in a tabular Excel-like format without leaving your map. In this article we'll identify some sanitary structures and then demonstrate how to switch between the List and Table views available for displaying results. We'll first turn on the targeted layer--in this case, our sanitary layer--and use the rectangular identify tool to select a group of sanitary features to observe in our results window.

Markup Tools

Markup Tools

Many of us find the need to mark our maps, draw in areas, and annotate decisions. We all have a preferred method depending on our needs. Tim prefers map printouts annotated with red pen. I mark up maps more digitally by using sharpie on my computer monitor (not really, IT would hate me). Below we'll show you how to mark up your GIS map (without resorting to ink-based marking devices). Within the Markup tab, you'll see your drawing options by clicking the triangle next to the drawing button.

GIS & WI MS4 Audits

20170118_100651
20170118_100651

Yesterday, our Waukesha office held a seminar concerning Wisconsin DNR audits for MS4 permit holders. While a bunch of great information was discussed, our very own Bronson Jastrow, GIS whiz and famed #TipTuesday writer, presented on how GIS can help keep communities prepared- especially if they're facing a dreaded audit!

One of the best ways GIS can help is by keeping communities organized. Our GIS capabilities allow you to link documents (such as design and compliance records) straight into a map, making them easy to access and all compiled in the same place.

2
2

Beyond the simplicity of linking, viewing, and organizing documents, we have a suite of tools that can make preparing for a DNR audit a breeze, such as: Erosion Control & Inspection, Illicit Discharge, Pond Inspection, and Storm Structure Maintenance & Cleaning - keeping a history of compliance on each storm water asset.

2
2

If you want more information on WDNR MS4 audits and how GIS can help, check in with your favorite GIS tech, or hop over to our website where we have the presentation slides uploaded!

GIS & Solar Eclipses

Solar eclipses are pretty neat. Even neater is being able to track past and future eclipses from any location in the world. You might be thinking, "Such technology cannot possibly be readily available for my consumption!" Luckily for you, there is a GIS map that lets you see over 600 years' worth of solar eclipses with just the click of a mouse! 1

The Solar Eclipse Finder gives you access to past and future solar eclipse occurrences by clicking anywhere on the map. With simple color coding (teal for past, orange for future), you can see locations with high eclipse frequency and others with none at all.

2

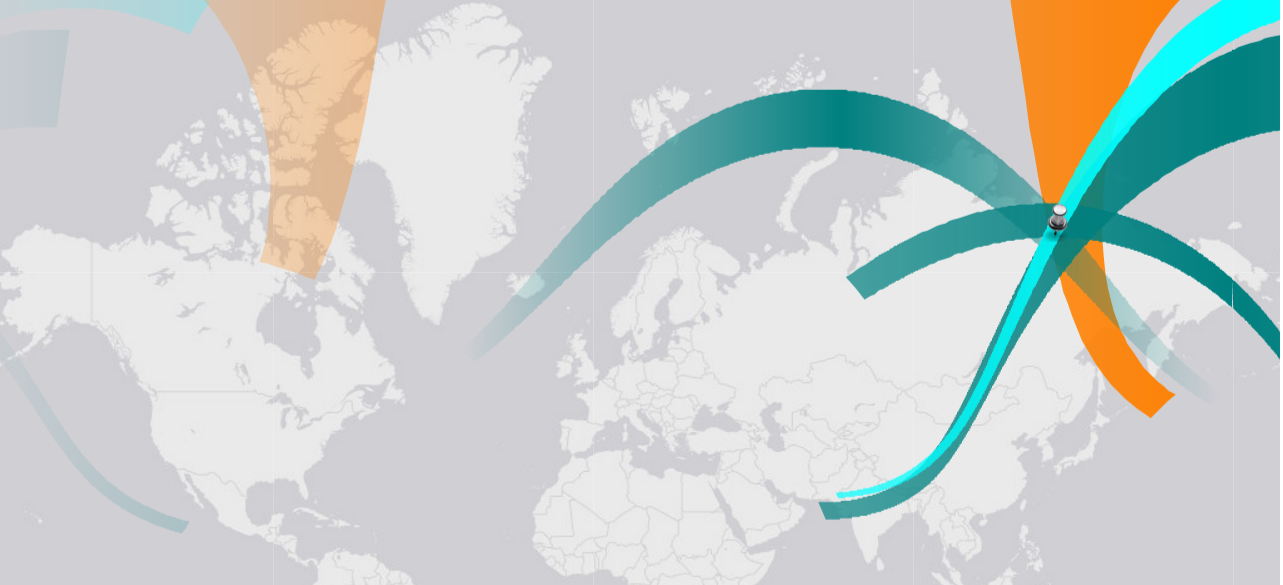
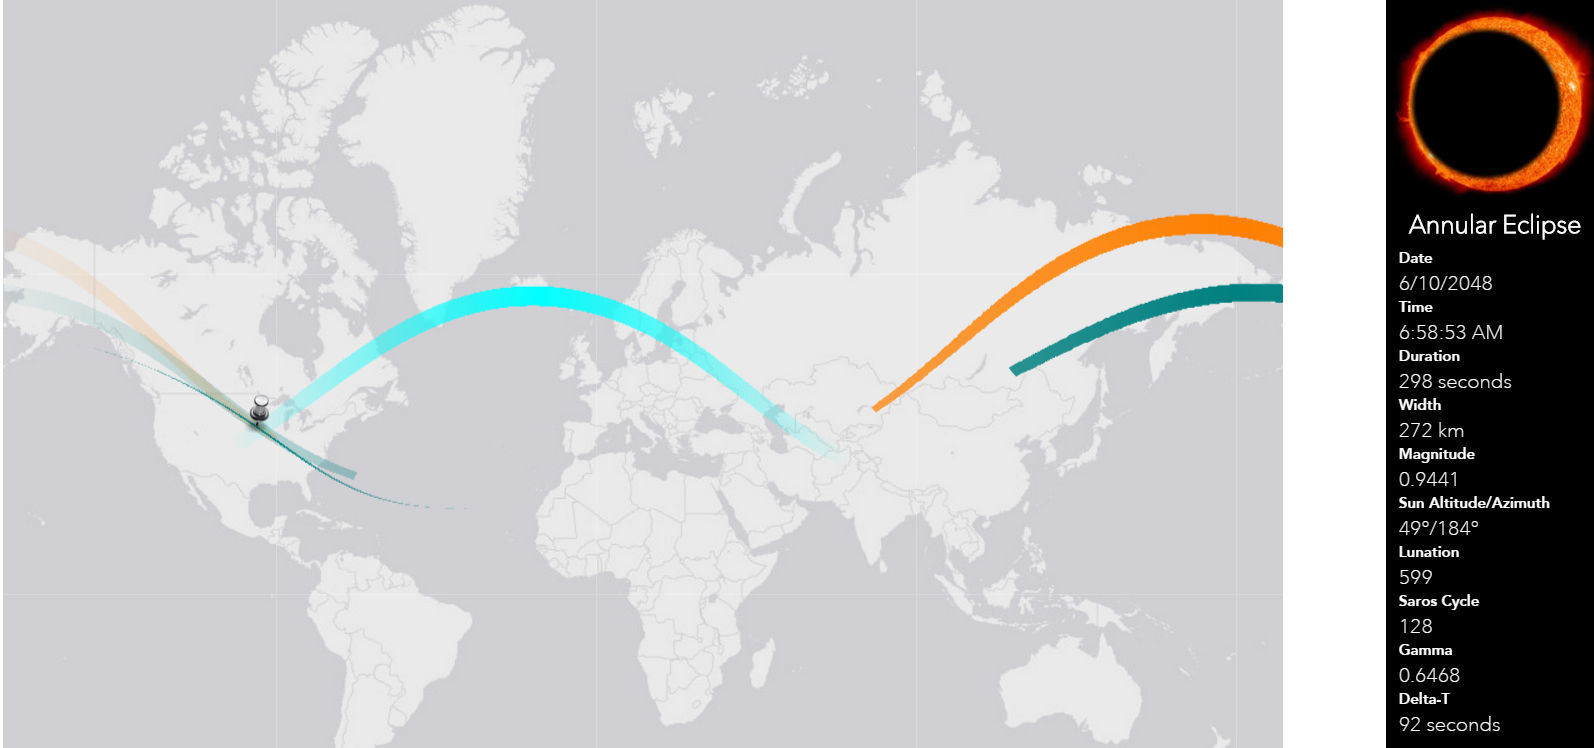
Clicking on any of the colored bands will give you information on the type, date, time, duration, size, and even more information about the solar eclipse. Where the band touches indicates where that solar eclipse will be able to be seen.

3

If you're curious to know if your hometown might have a solar eclipse in its future, simply click on the map! Thanks to GIS capabilities, this information is easy to access and visually intuitive.