Aviation and GIS Applications - National Air Traffic Control Day

Aviation and GIS Applications - National Air Traffic Control Day

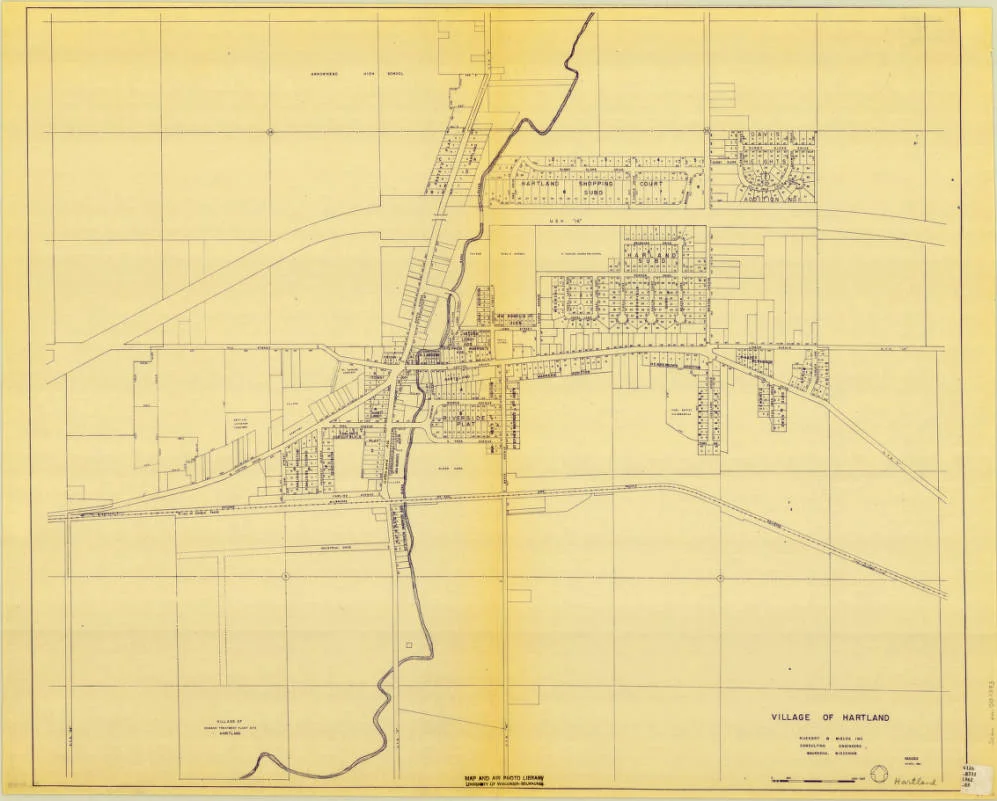
July 6th, 1986 indicated the fiftieth anniversary of the formation of an airways traffic control system by the United States Bureau of Air Commerce. Within that fifty-year extent, the nation's air traffic control system had progressed from dependence on fairly simple, unsophisticated equipment and procedures to a much more advanced automated system, which safely and resourcefully processed millions of flights each year and functioned as an example for the world aviation community. With the expertise and dedication of thousands of Federal Aviation Administration employees (including air traffic controllers, electronic technicians, and engineers), the national air traffic control system presented a high level of security and efficiency, which has only continued to technologically thrive since!

American Geographical Society Library

American Geographical Society Library

Happy National Camera Day! What better way to celebrate than exploring the digital collections on UW-Milwaukee's very own American Geographical Society Library (AGSL) website. The digital collections consist of online maps and photos, aerial photography, and geospatial data. The library is also open to the public if you would like to view their wide array of print collections (cartographic, photographic, archives, and books). Have some fun browsing the website to learn about the history of the AGSL and maybe do a little research of your own!

GIS and Lightning

GIS and Lightning

Did you know that globally there are approximately 40-50 lightning flashes per second?! Maps that provide us with the distribution of lightning across the world are utilized for environmental, economic, and safety purposes. Lightning is a danger to humans, wildlife, and livestock. It also causes BILLIONS of dollars in damage to buildings, communication systems, power lines, and electrical equipment.

Sign Support Tool

Sign Support Tool

Nothing says spring cleaning like completing an inventory on the conditions of your street signs. Let us help you spruce up your town by starting or continuing to build on your inventory with our Street Sign Support tool! Our street sign tool is quick and easy to use. The tool provides a preloaded dashboard that gives users the ability to input information on new or existing signage with just a few short clicks.

As-built Upload Tool

As-built Upload Tool

Uploading your record drawings as points using your Document Upload Tool is all well and good, but what if you want your asbuilts tied directly to your assets? Look no farther than the Asbuilt Upload Tool. If you have the tool in your site, you will see it under one of your tabs with this icon:

Table View vs. List View

Table View vs. List View

When identifying features, you have the ability to view your data in a tabular Excel-like format without leaving your map. In this article we'll identify some sanitary structures and then demonstrate how to switch between the List and Table views available for displaying results. We'll first turn on the targeted layer--in this case, our sanitary layer--and use the rectangular identify tool to select a group of sanitary features to observe in our results window.

GIS & GISCorps

GIS & GISCorps

GISCorps is a group of GIS professionals that volunteer their time and skills in order to create a better world. Started in 2003, GISCorps' goals revolve around helping to improve quality of life through supporting humanitarian relief, enhancing environmental analysis, encouraging and fostering economic development, supporting community planning and development, strengthening local capacity by adopting and using information technology, and supporting health and education related activities.

GIS & Local Insights

GIS & Local Insights

Utilizing GIS for its mapping capabilities is a no-brainer. Answering questions like "what's the fastest route to work" or "where is that manhole located" are all great uses of GIS. But, using GIS for local insights can help individuals, businesses, communities, virtually anyone to make better, smarter choices.

Markup Tools

Markup Tools

Many of us find the need to mark our maps, draw in areas, and annotate decisions. We all have a preferred method depending on our needs. Tim prefers map printouts annotated with red pen. I mark up maps more digitally by using sharpie on my computer monitor (not really, IT would hate me). Below we'll show you how to mark up your GIS map (without resorting to ink-based marking devices). Within the Markup tab, you'll see your drawing options by clicking the triangle next to the drawing button.

GIS & Ocean Ecosystems

GIS & Ocean Ecosystems

With this new 3D map, oceanographers, scientists, conservationists, and more can track ecosystems in unprecedented detail. This tool, which can divide the water masses of oceans into precise, detailed categories can help conservation efforts, as it maps data that shows why marine animals live where they do. This can help track which parts of the ocean will be most habitable for marine life - and thus more necessary to protect.

GIS & WI MS4 Audits

20170118_100651
20170118_100651

Yesterday, our Waukesha office held a seminar concerning Wisconsin DNR audits for MS4 permit holders. While a bunch of great information was discussed, our very own Bronson Jastrow, GIS whiz and famed #TipTuesday writer, presented on how GIS can help keep communities prepared- especially if they're facing a dreaded audit!

One of the best ways GIS can help is by keeping communities organized. Our GIS capabilities allow you to link documents (such as design and compliance records) straight into a map, making them easy to access and all compiled in the same place.

2
2

Beyond the simplicity of linking, viewing, and organizing documents, we have a suite of tools that can make preparing for a DNR audit a breeze, such as: Erosion Control & Inspection, Illicit Discharge, Pond Inspection, and Storm Structure Maintenance & Cleaning - keeping a history of compliance on each storm water asset.

2
2

If you want more information on WDNR MS4 audits and how GIS can help, check in with your favorite GIS tech, or hop over to our website where we have the presentation slides uploaded!

GIS & Solar Eclipses

Solar eclipses are pretty neat. Even neater is being able to track past and future eclipses from any location in the world. You might be thinking, "Such technology cannot possibly be readily available for my consumption!" Luckily for you, there is a GIS map that lets you see over 600 years' worth of solar eclipses with just the click of a mouse! 1

The Solar Eclipse Finder gives you access to past and future solar eclipse occurrences by clicking anywhere on the map. With simple color coding (teal for past, orange for future), you can see locations with high eclipse frequency and others with none at all.

2

Clicking on any of the colored bands will give you information on the type, date, time, duration, size, and even more information about the solar eclipse. Where the band touches indicates where that solar eclipse will be able to be seen.

3

If you're curious to know if your hometown might have a solar eclipse in its future, simply click on the map! Thanks to GIS capabilities, this information is easy to access and visually intuitive.


GIS & Clean Streets

Los Angeles is getting street clean-up help for the entire city, street by street, with the use of GIS capabilities. LA's mayor, Eric Garcetti, has started a Clean Streets Initiative that entails driving every single street in LA and giving the block a "cleanliness score" from 1-3 (1=Clean, 2=Somewhat Clean, 3=Not Clean). This practice puts LA as a leader in the US, as it's the only large city conducting a regular cleanliness assessment of every city street. 1

Once each street is assigned a number, the City is broken up into grids to help the Bureau of Sanitation strategically deploy resources to areas, such as a new dedicated Clean Streets clean-up crew. Clicking on any grid will tell you the area, and the average score of the streets within the grid.

2  3

Using this information, the City can indicate areas of the most need, like making sure there are clean routes to school, preventing illegal dumping hotspots, and deploying trash bins in litter-heavy areas.

4

Zoning Tool

Zoning Tool

While the most accurate way to track Zoning is via direct editing in ArcMap software, the “Zoning Add/Edit” tool can be used for quick zoning changes that follow parcel lines. Found under the "Public Works" tab, the tool allows users to select parcels and add/edit the zoning information displayed in the map.