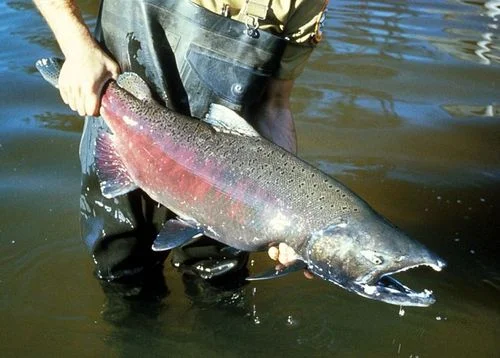
Did you know that Fall is prime time for shore fishing in Wisconsin? The Fall Fishing Google Map includes driving directions, fish species, and a picture of shore fishing locations. There are 50 areas on the map within 60 minutes of Milwaukee!

Articles
Explore AssetAlly Tips & Tools.
See GIS in Action.
September 22, 2017 is the astronomical start of fall here in the Northern Hemisphere! The interactive map below (click on image to link to website) has been produced to forecast peak leaf colors each year. The map compiles National Weather Service data on historical temperatures, forecast temperatures, and forecast precipitation, as well as historical leaf peak and peak observation trends in order to make the most accurate predictions.
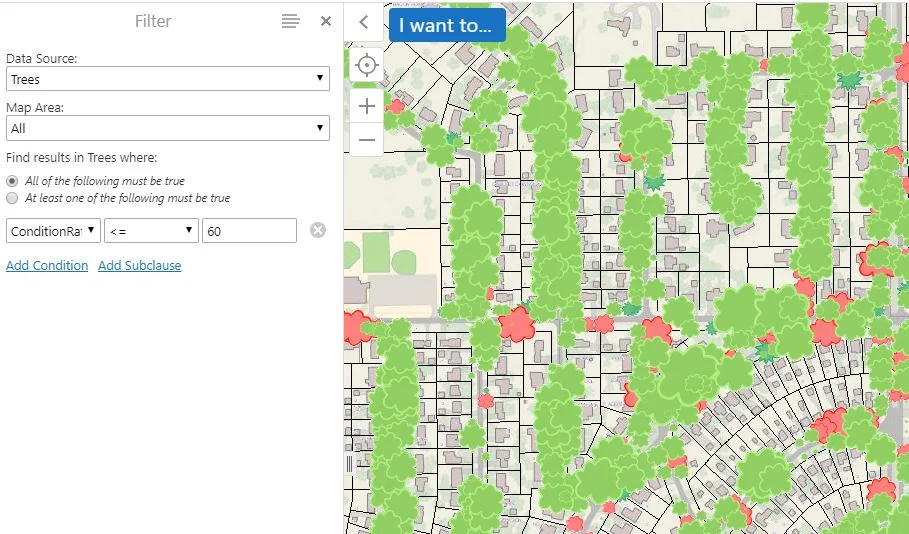
Using the filter tool is a great way to sort anything in your GIS application that requires routine maintenance (i.e. valves, trees). A filter presents a focused view of a feature layer in a map. By limiting the visibility of features in a layer, you can reveal what's important. To begin, we click on the filter button on our toolbar.
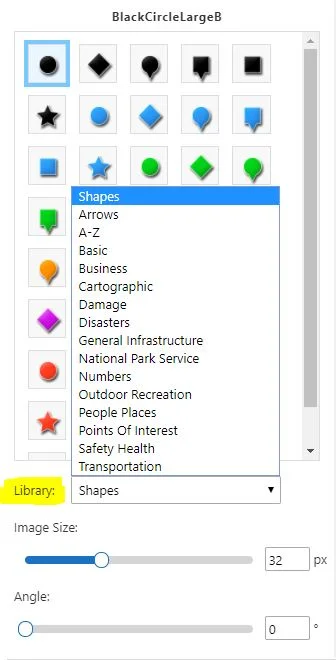
One of the more recent features that have been added to your GIS applications allows you the ability to add an image for a new point (or points) on the map, using the markup tool. What does this mean? Well, we'll show you! First, you will want to go under "Markup" in your viewer and choose the point option.
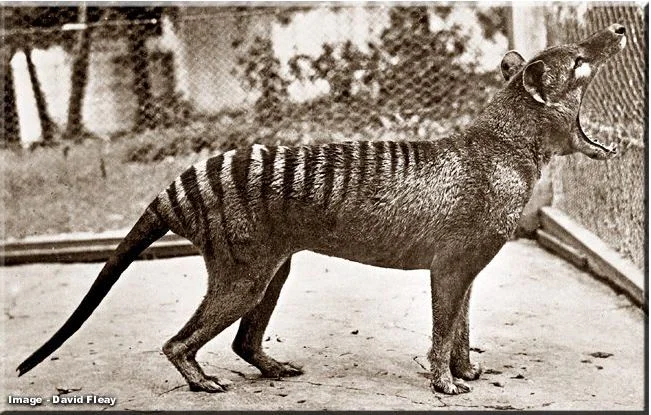
On September 7, 1936 the last thylacine (Thylacinus cynocephalus aka Tasmanian tiger/wolf) died at the Hobart Zoo in Tasmania. Fifty years later the entire species was declared extinct. Today is remembered in Australia as "National Threatened Species Day." In more recent times, throughout the world, many humans understand and value the importance of biodiversity and protecting wildlife.How has GIS contributed to wildlife management and protection?
Did you know that the Green Bay Packers, who joined the APFA in 1921 just before the name change, are the only current team in the history of NFL who have maintained their name and location for its duration? View these maps of the history of the NFL and if the NFL divisions if they were to be based purely on geography.
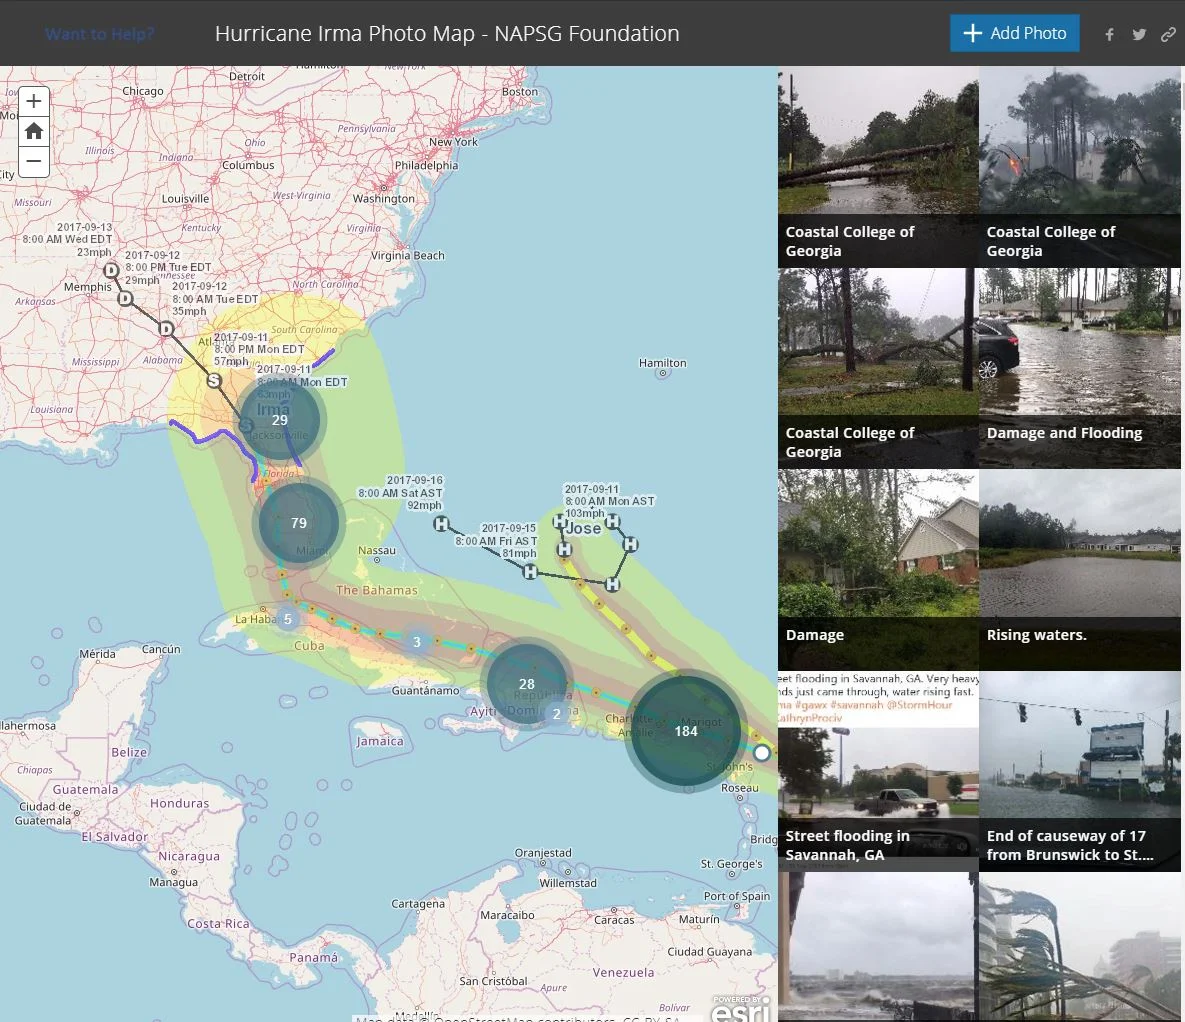
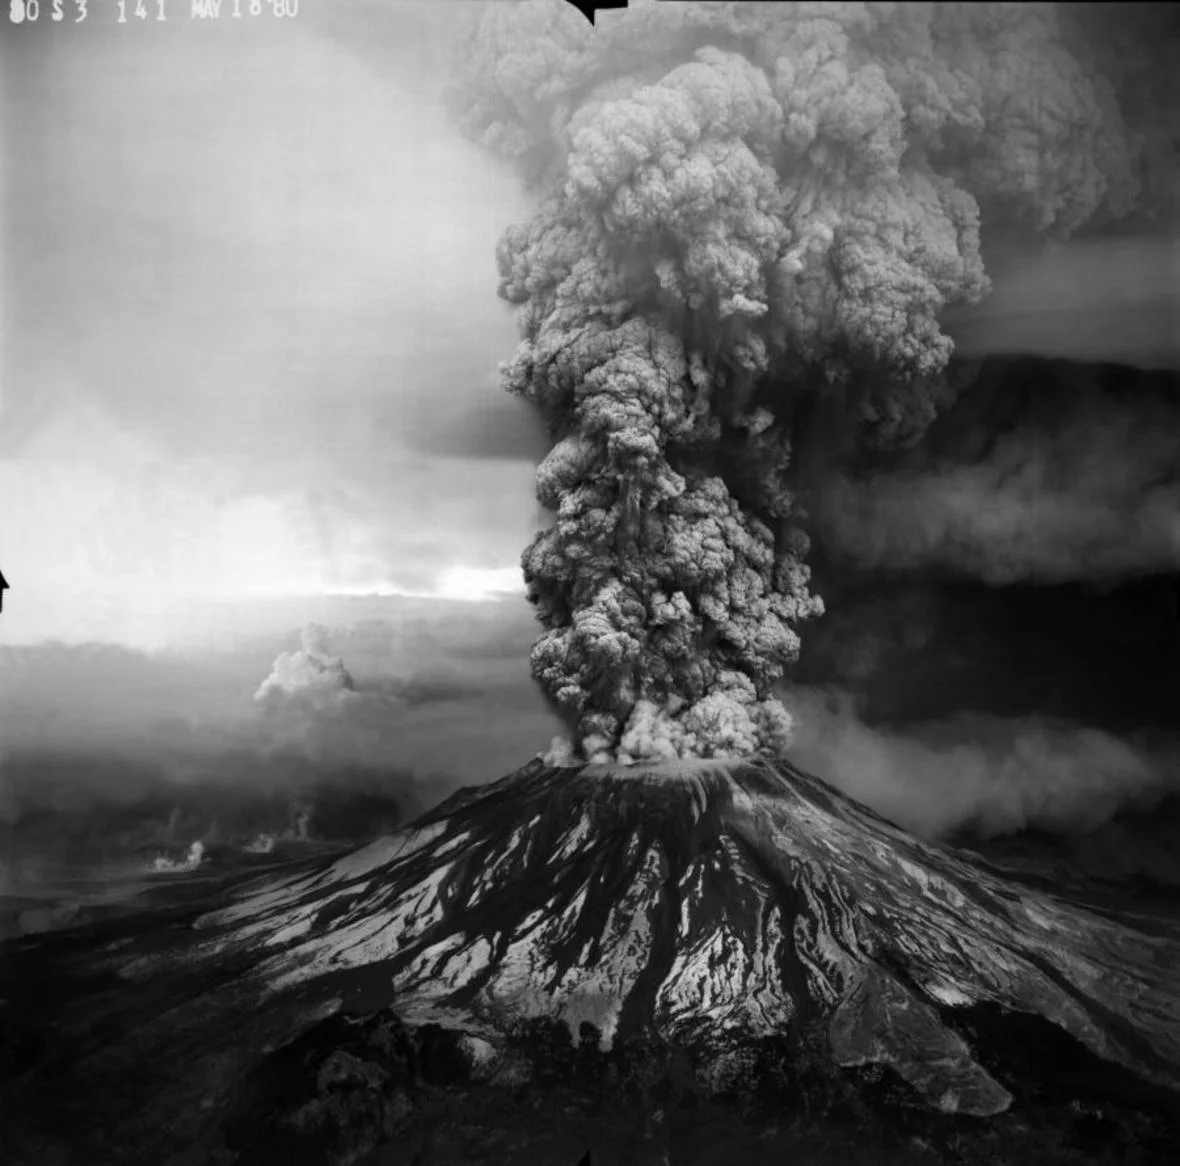
On August 24th, 79 CE Mt. Vesuvius erupted, burying the Roman settlements of Pompeii & Herculaneum. Remains of approximately 1,500 people have been discovered, but the overall death toll is still unknown. GIS provides a tool for extending hazard and vulnerability mapping to assist in the analysis of risk.
Today we will be explaining how the "Link Asbuilt" tool is utilized in your GIS viewer. This tool is extremely helpful to those working out in the field, as well as in the office. It is a way to archive and retrieve as-built documentation for when issues may arise. With the flow and accessibility of this information being streamlined, project decision-making efficiency can be significantly improved. We are able to link your engineering record drawings directly into your GIS. Here is how you access them:
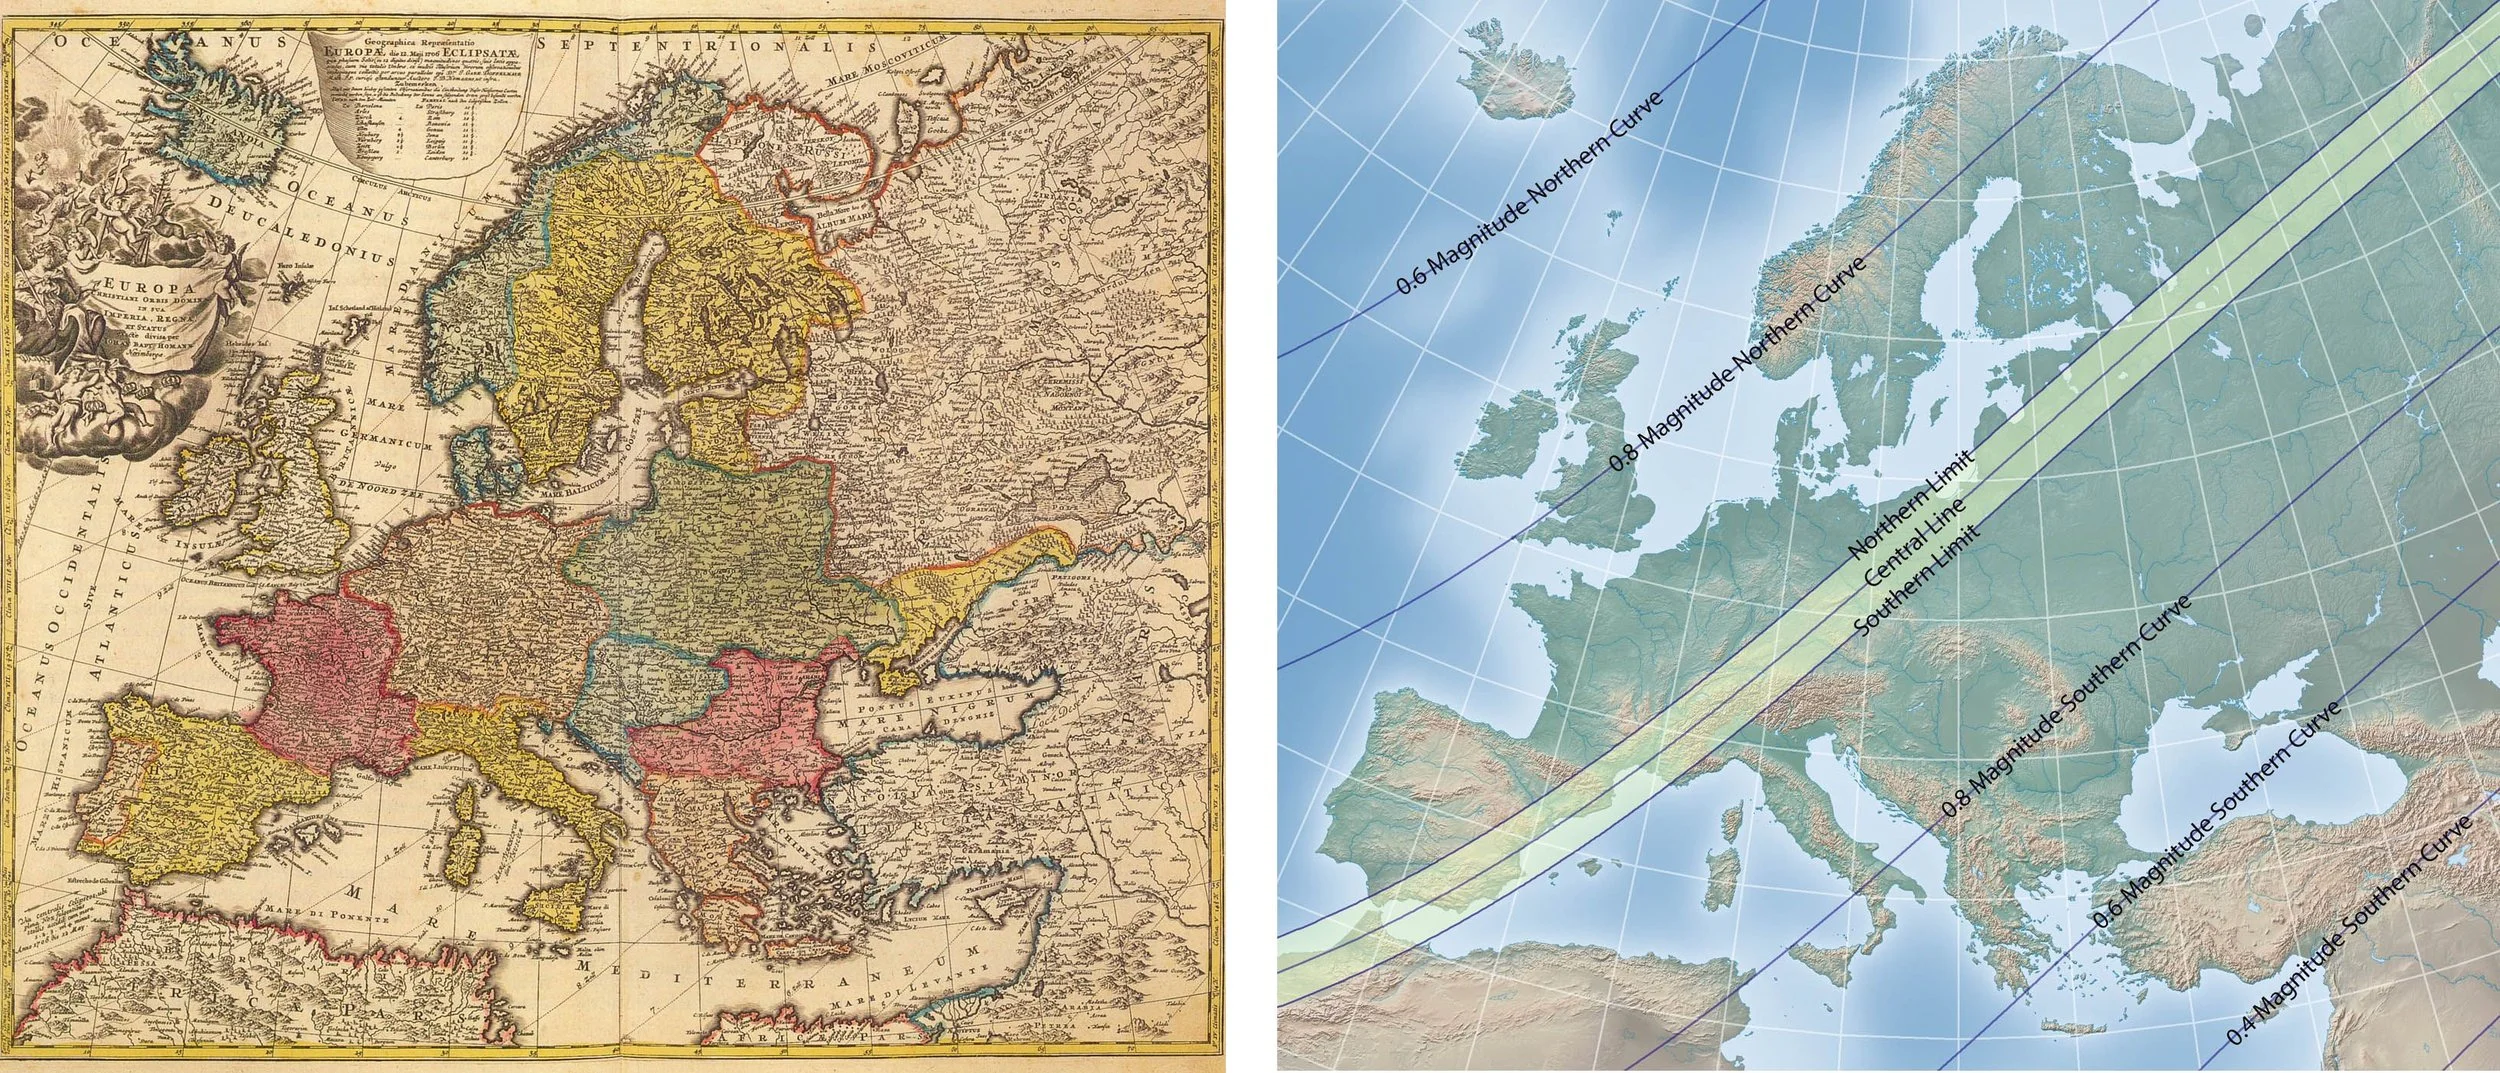
This upcoming Monday (August 21st, 2017), the sun and moon will align, giving Americans a front row seat to a rare celestial event - a total solar eclipse (of the heart...sorry)! You can click on the following image below to link to a variety of websites, maps (some interactive) which show the path of the 2017 eclipse, eclipse calculators, and other unique information pertaining to the subject matter.
If you are interested in looking at information in a particular area within your GIS application, then you are probably familiar with the "identify" tool.You may also be familiar with the typically long list of features that show up in the "Identify Results" viewer, even if only selecting a small section on your map. Of course this list will be smaller depending upon how many layers you have turned on.
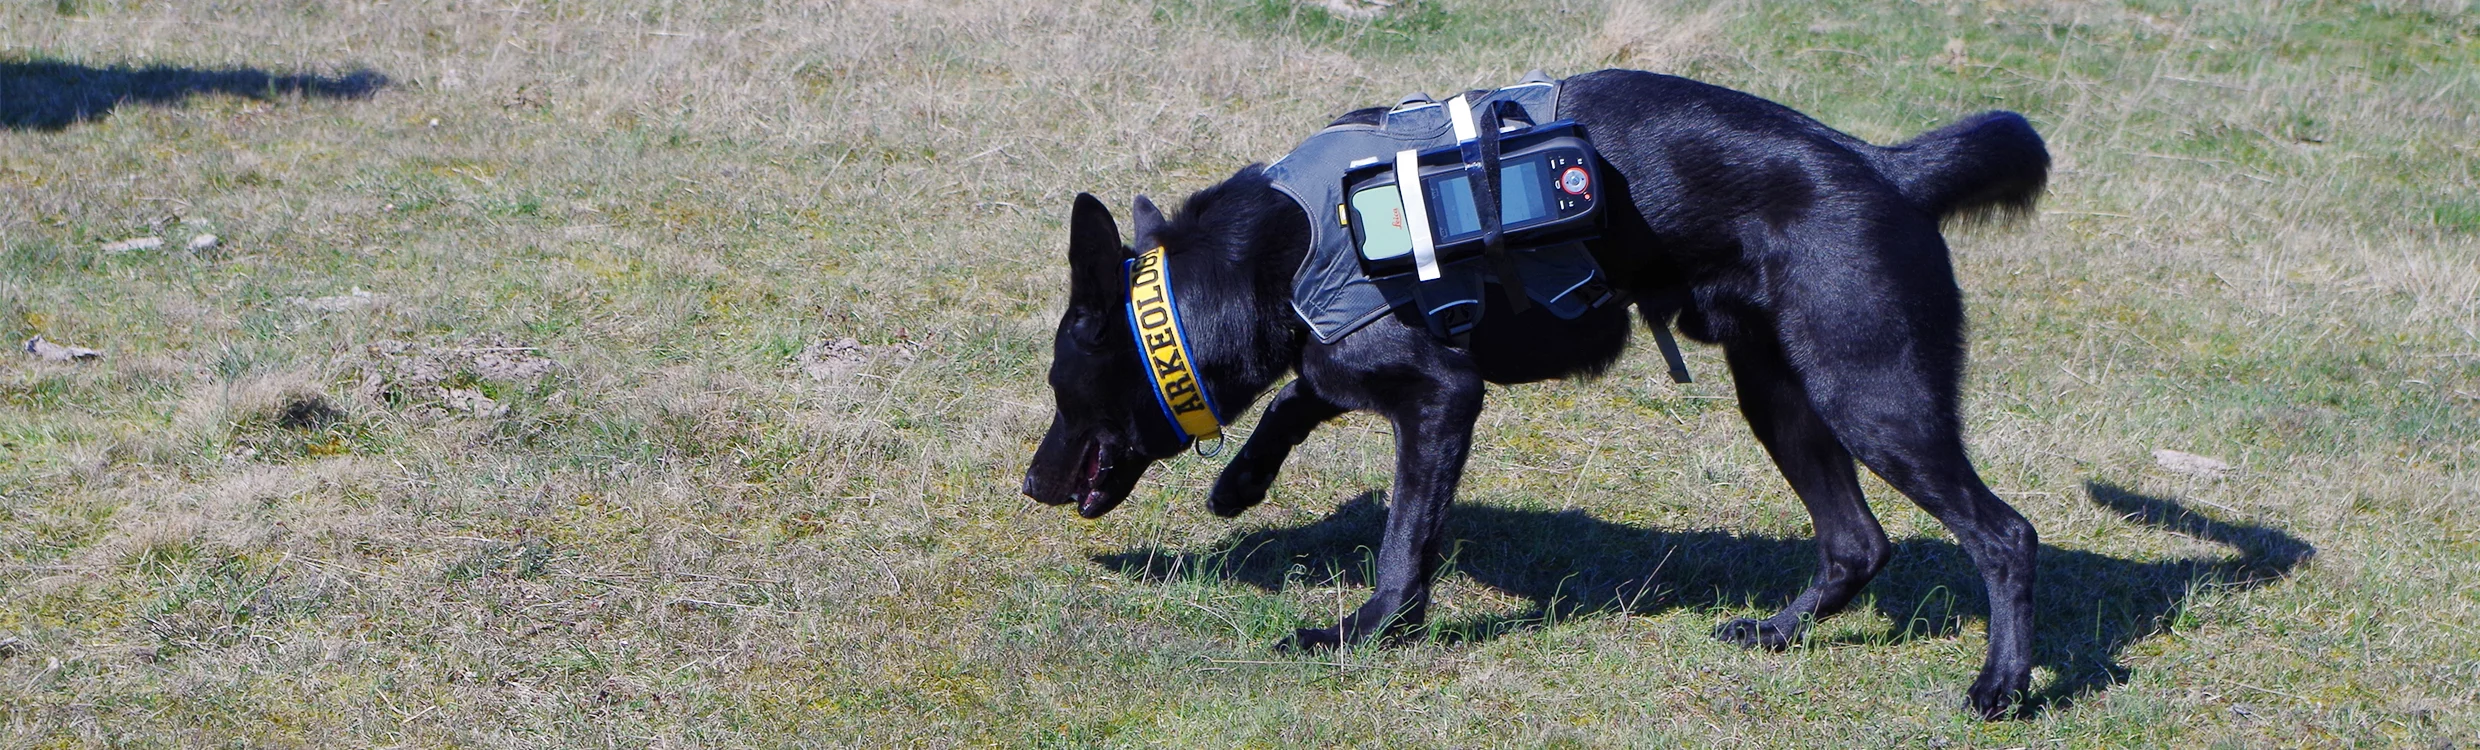
As we do so much for our little (or big) buddies, they have done some pretty amazing things for us humans too. To avoid getting off the topic of GIS, why don't I introduce you to Fabel? Fabel is the world's first licensed Arkeologihunden (archaeology dog) that is digging to make a difference with the assistance of GIS technology!
Today we will be discussing the "Filter Layers" option in the layer list. This new feature lets you find layers in your site faster.Many of you have spent years getting all sorts of information into your GIS system. This is great for analysis and exhibits, but the mass of layers can be hard to sort through. Layers can get buried in folder within folders and becomes hard to turn on. As you notice in the photo below, there are many folders that may be expanded within a layer toolbar! This can sometimes make it a bit of a hassle to find what you are looking for.
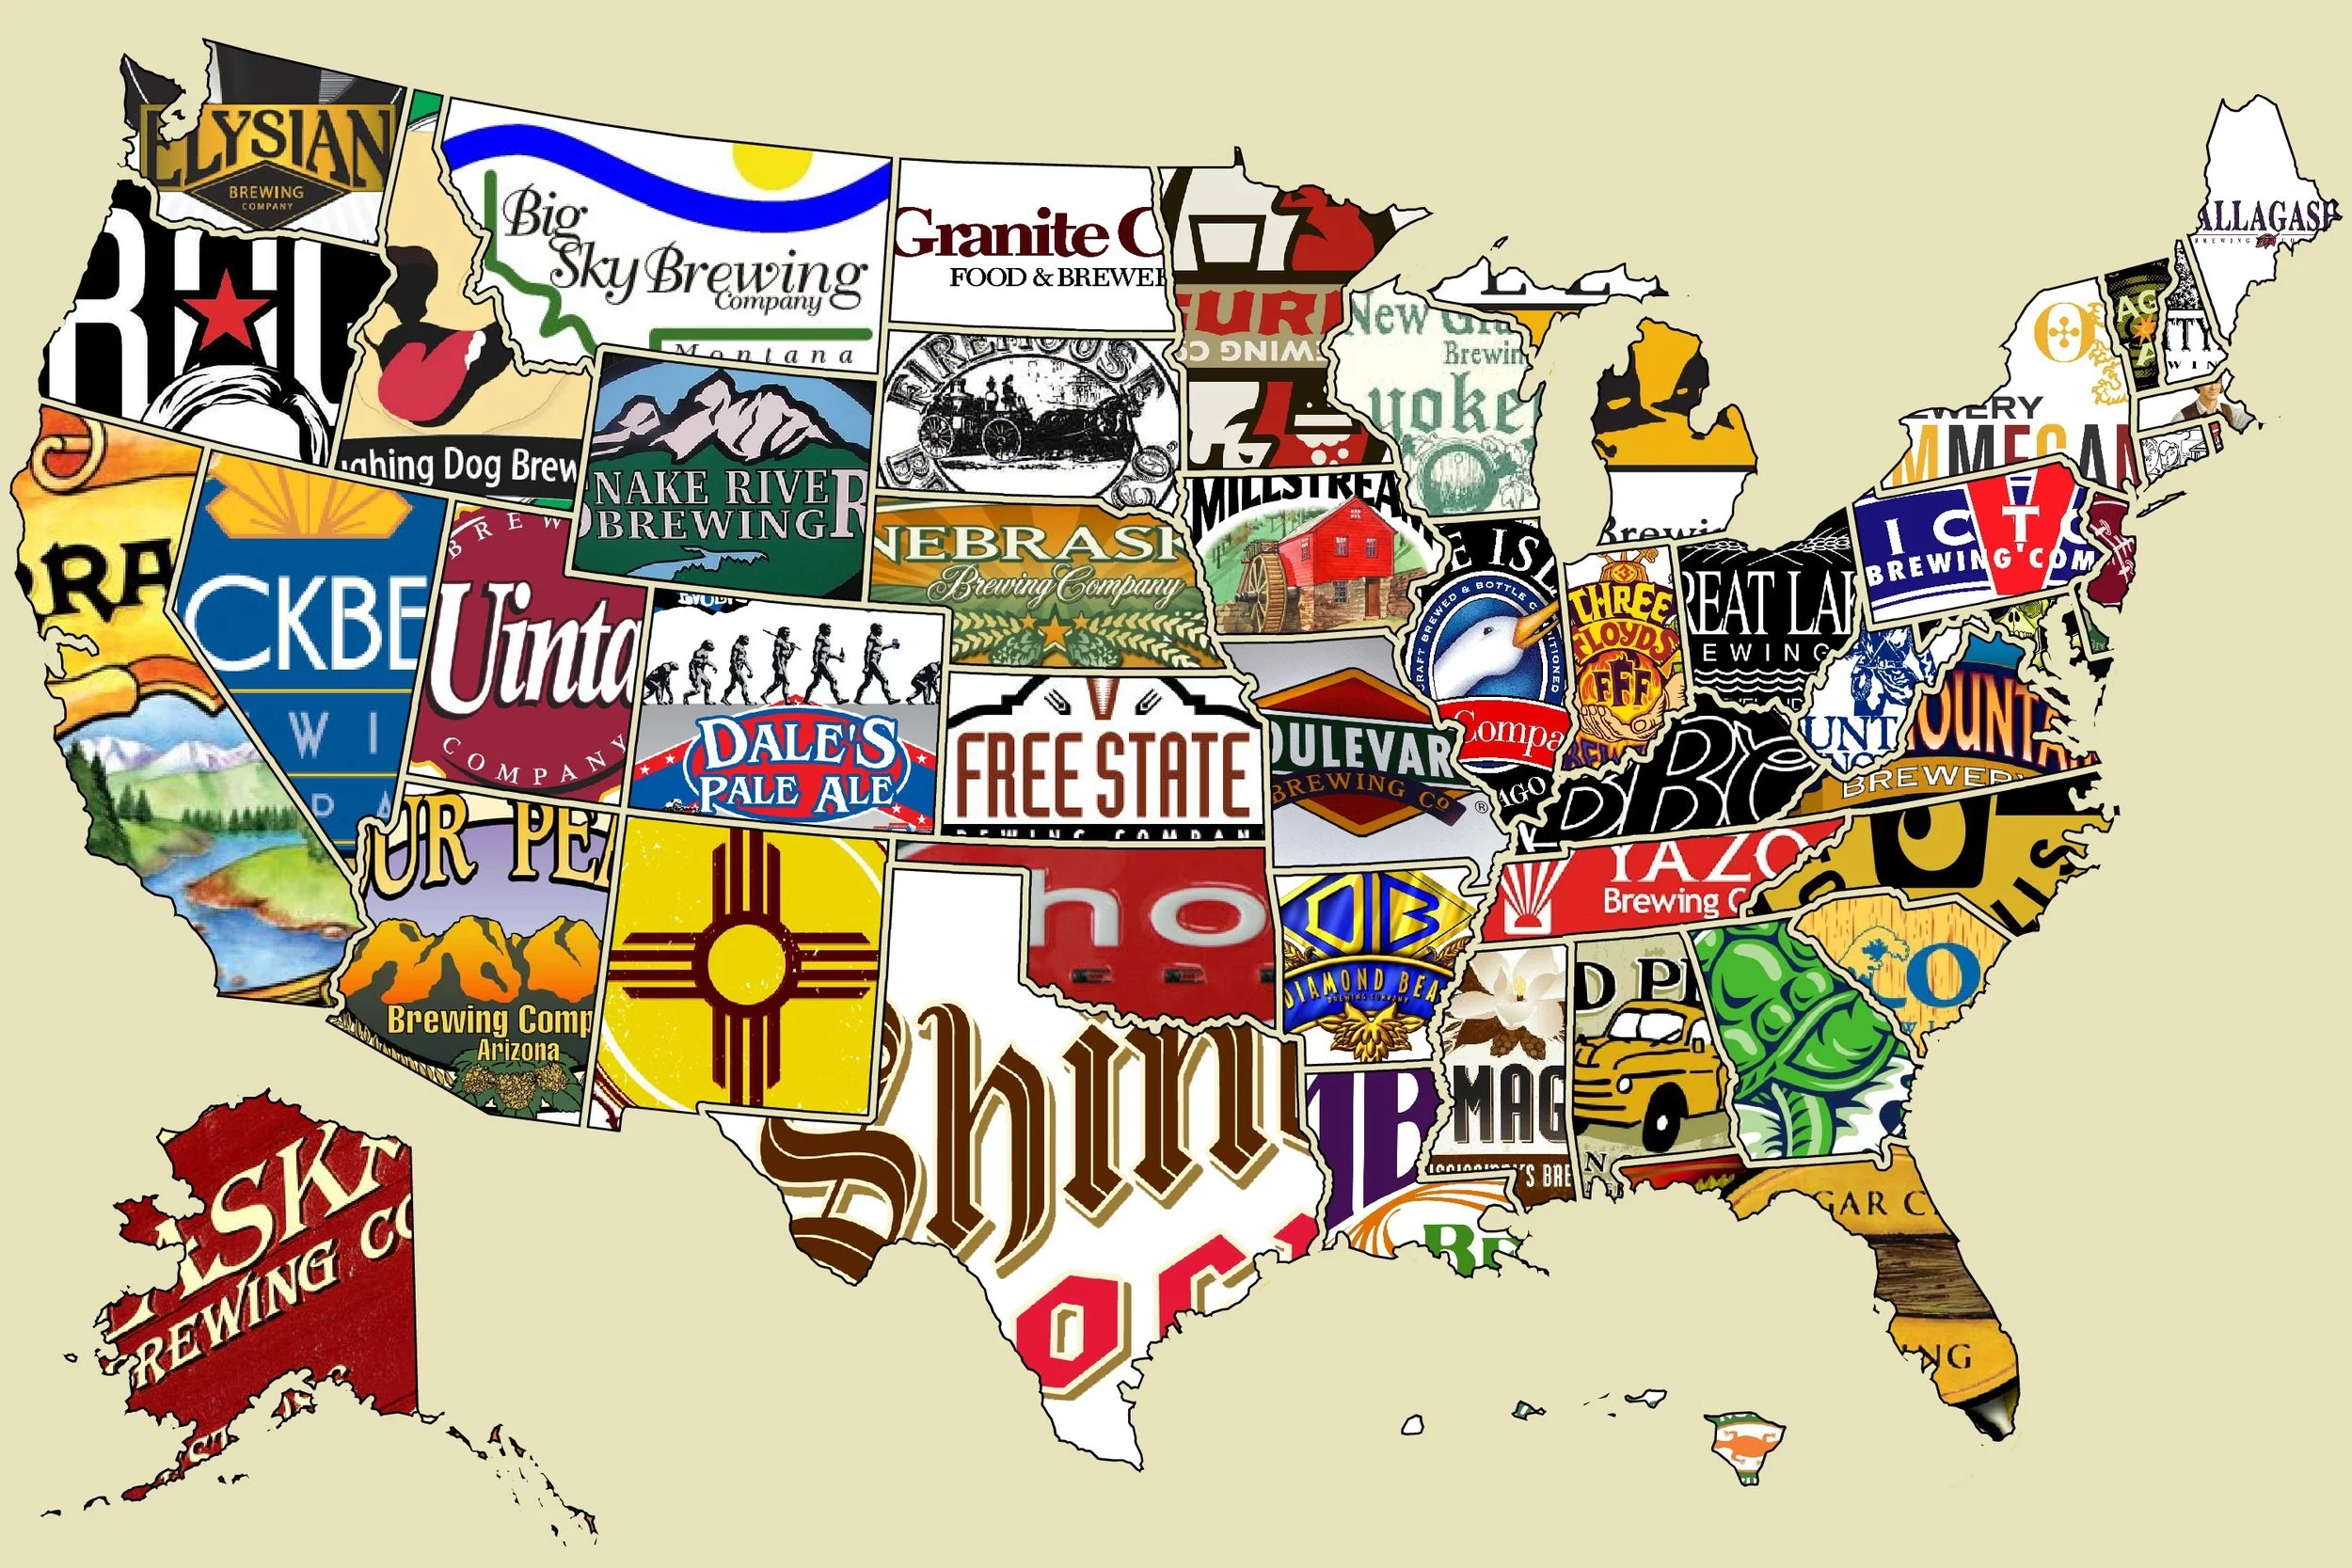
Today is recognized as National Refreshment Day! Seeing as beer has been a rich part of Wisconsin culture and history, why not explore a creative approach that has been taken in the mapping of beer! First, here is an interesting read by Andrew Shears, Local to National and Back Again: Beer, Wisconsin, and Scale, a chapter in his book "The Geography of Beer."
In case you haven't yet noticed, we have updated your GIS applications! Along with this update there are plenty of new features that will make navigating and searching for specific information more efficient for you. On this #tiptuesday, we will go over how the "Identify Results" list now supports grouping of results by layer. Additionally, there is improved highlighting (which will be explained as we move on).