On this blog, we talk a lot about how GIS relates to everyday life. But, one of the best things about GIS is it enables us to explore hypothetical situations in very cool ways. A great example is a new map on Esri titled "(Is there) Life on Mars?"

Articles
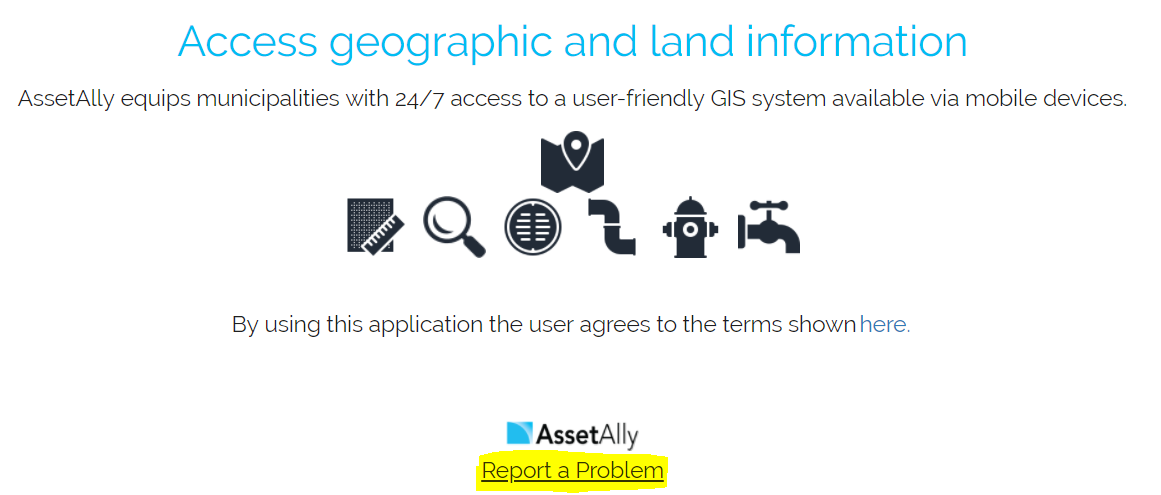
Explore AssetAlly Tips & Tools.
See GIS in Action.
With this new 3D map, oceanographers, scientists, conservationists, and more can track ecosystems in unprecedented detail. This tool, which can divide the water masses of oceans into precise, detailed categories can help conservation efforts, as it maps data that shows why marine animals live where they do. This can help track which parts of the ocean will be most habitable for marine life - and thus more necessary to protect.
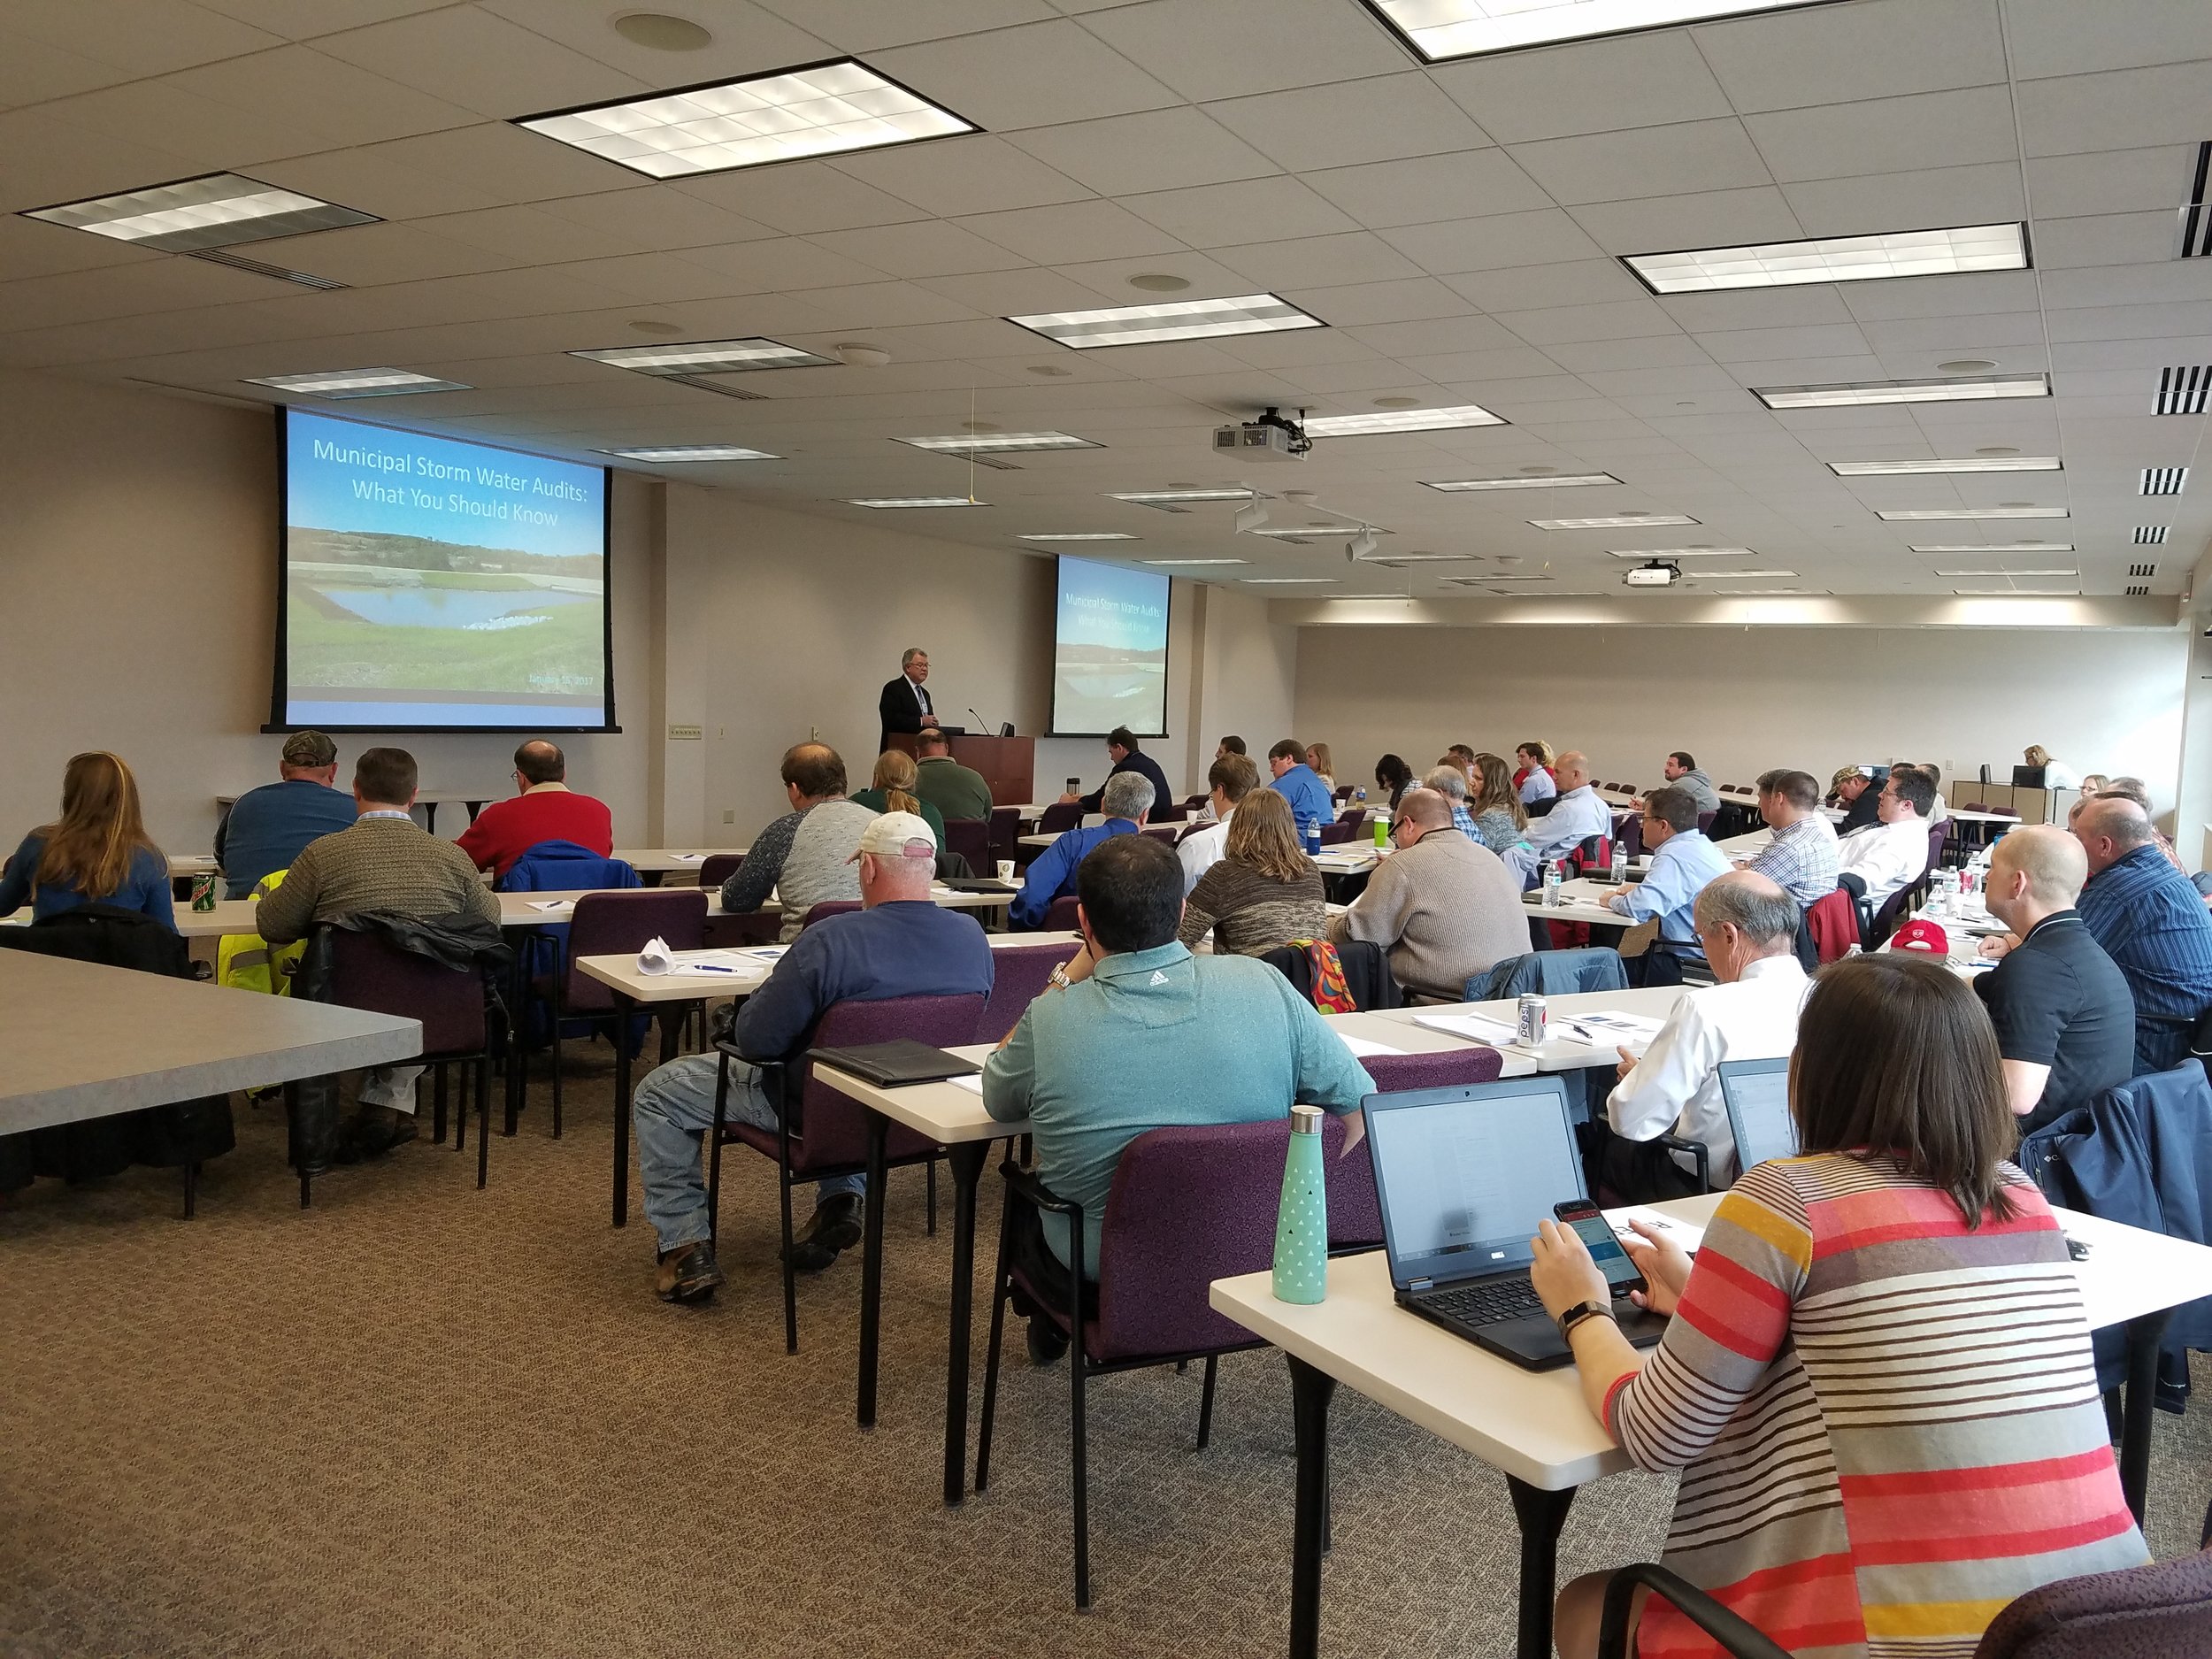
Yesterday, our Waukesha office held a seminar concerning Wisconsin DNR audits for MS4 permit holders. While a bunch of great information was discussed, our very own Bronson Jastrow, GIS whiz and famed #TipTuesday writer, presented on how GIS can help keep communities prepared- especially if they're facing a dreaded audit!
One of the best ways GIS can help is by keeping communities organized. Our GIS capabilities allow you to link documents (such as design and compliance records) straight into a map, making them easy to access and all compiled in the same place.

Beyond the simplicity of linking, viewing, and organizing documents, we have a suite of tools that can make preparing for a DNR audit a breeze, such as: Erosion Control & Inspection, Illicit Discharge, Pond Inspection, and Storm Structure Maintenance & Cleaning - keeping a history of compliance on each storm water asset.

If you want more information on WDNR MS4 audits and how GIS can help, check in with your favorite GIS tech, or hop over to our website where we have the presentation slides uploaded!
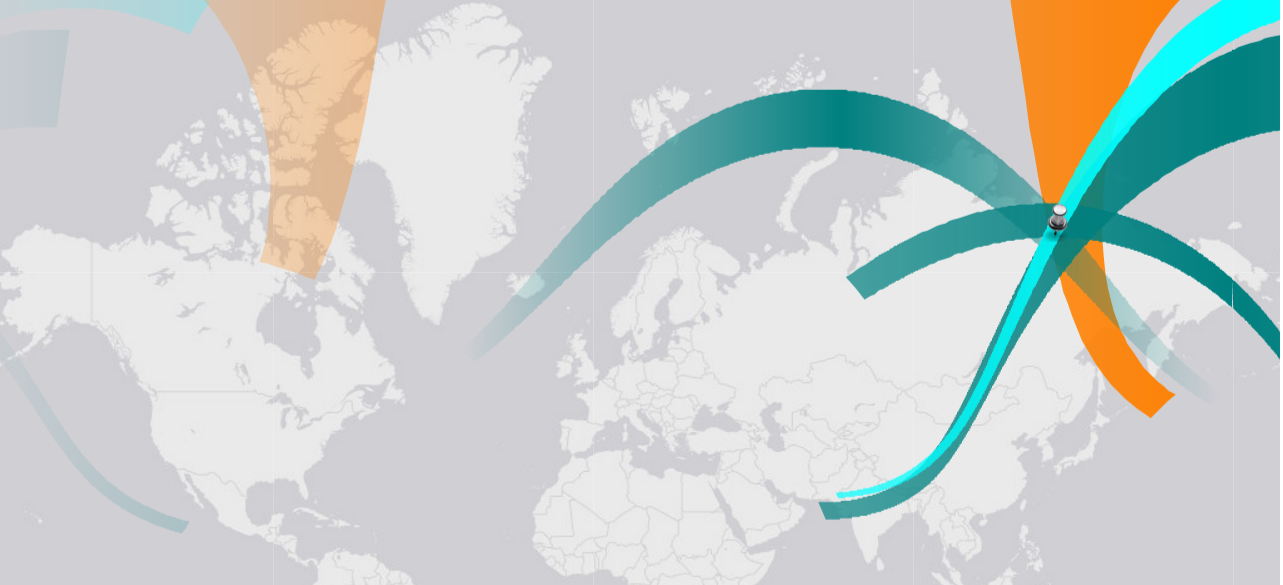
Solar eclipses are pretty neat. Even neater is being able to track past and future eclipses from any location in the world. You might be thinking, "Such technology cannot possibly be readily available for my consumption!" Luckily for you, there is a GIS map that lets you see over 600 years' worth of solar eclipses with just the click of a mouse!

The Solar Eclipse Finder gives you access to past and future solar eclipse occurrences by clicking anywhere on the map. With simple color coding (teal for past, orange for future), you can see locations with high eclipse frequency and others with none at all.
Clicking on any of the colored bands will give you information on the type, date, time, duration, size, and even more information about the solar eclipse. Where the band touches indicates where that solar eclipse will be able to be seen.
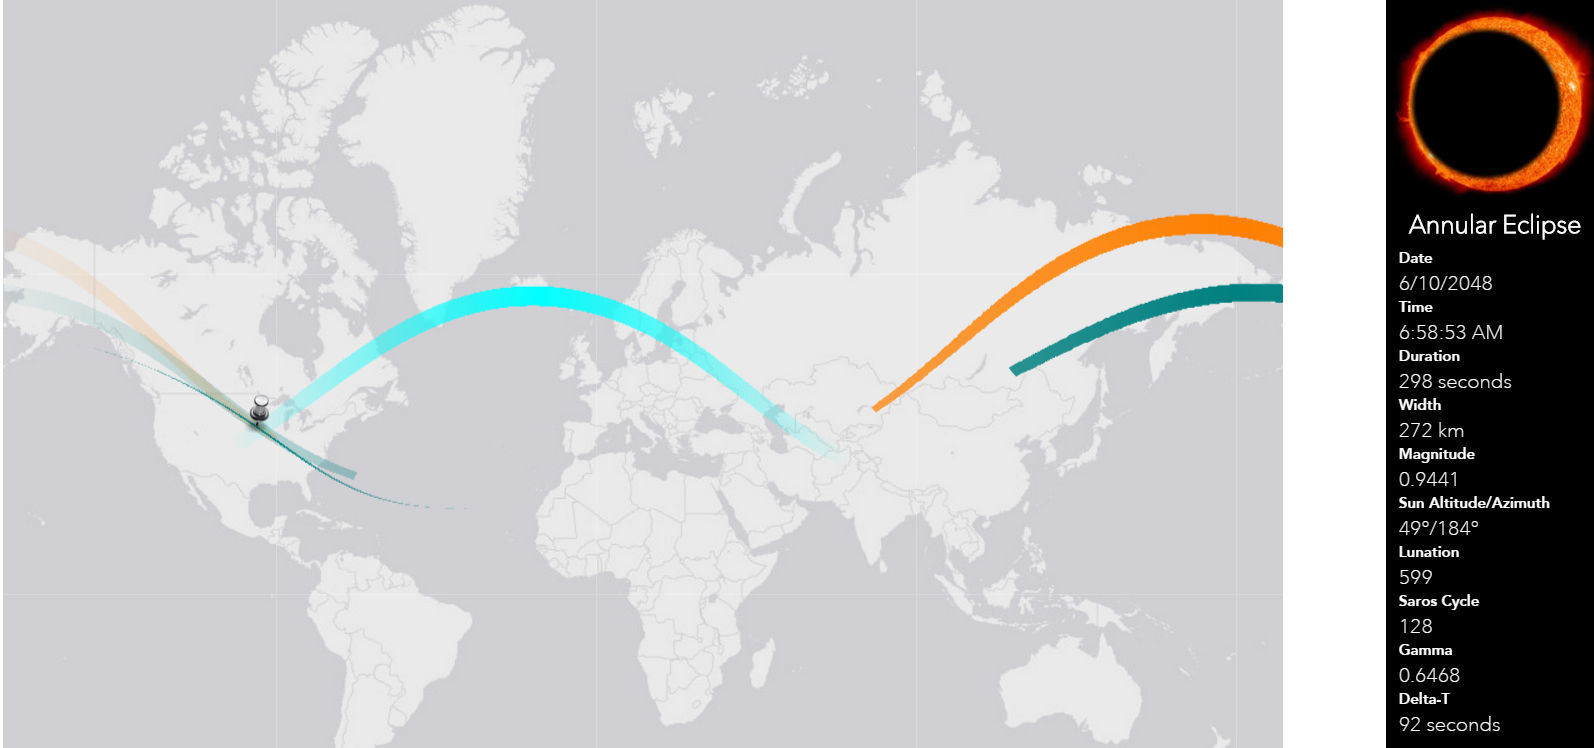
If you're curious to know if your hometown might have a solar eclipse in its future, simply click on the map! Thanks to GIS capabilities, this information is easy to access and visually intuitive.
Los Angeles is getting street clean-up help for the entire city, street by street, with the use of GIS capabilities. LA's mayor, Eric Garcetti, has started a Clean Streets Initiative that entails driving every single street in LA and giving the block a "cleanliness score" from 1-3 (1=Clean, 2=Somewhat Clean, 3=Not Clean). This practice puts LA as a leader in the US, as it's the only large city conducting a regular cleanliness assessment of every city street.

Once each street is assigned a number, the City is broken up into grids to help the Bureau of Sanitation strategically deploy resources to areas, such as a new dedicated Clean Streets clean-up crew. Clicking on any grid will tell you the area, and the average score of the streets within the grid.


Using this information, the City can indicate areas of the most need, like making sure there are clean routes to school, preventing illegal dumping hotspots, and deploying trash bins in litter-heavy areas.

While the most accurate way to track Zoning is via direct editing in ArcMap software, the “Zoning Add/Edit” tool can be used for quick zoning changes that follow parcel lines. Found under the "Public Works" tab, the tool allows users to select parcels and add/edit the zoning information displayed in the map.