
Today we will be showing you another fun way in which we are able to use the "Turn on/off layer visualizations" for symbolizing various attributes on your utilities. In our example today, we will be visualizing the sanitary pipes in our GIS based off of their material makeup. The first step is turning your sanitary pipe layer on. We will then click on the arrow next to the item in the layer list.

Then, we will click "Turn on/off layer visualizations."

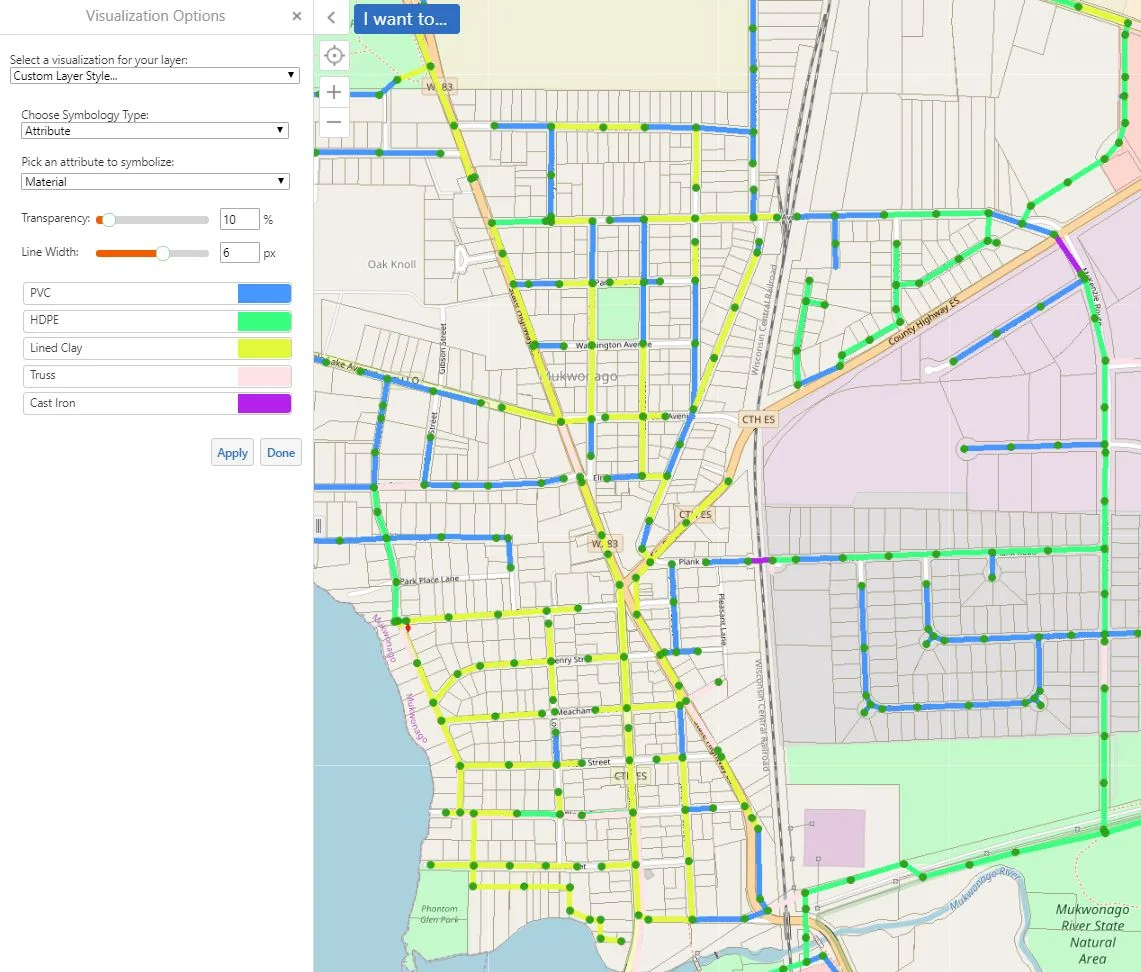
As we can see in the screen shot below, we selected "custom layer style," "attribute," and "material" from the drop down menus offered.

When we are satisfied with our selections, we simply click "Apply." This process is much more efficient than clicking on individual pipe segments in order to view their details.

We recommend keeping these processes in mind when you would like to view specific details on a larger scale.
