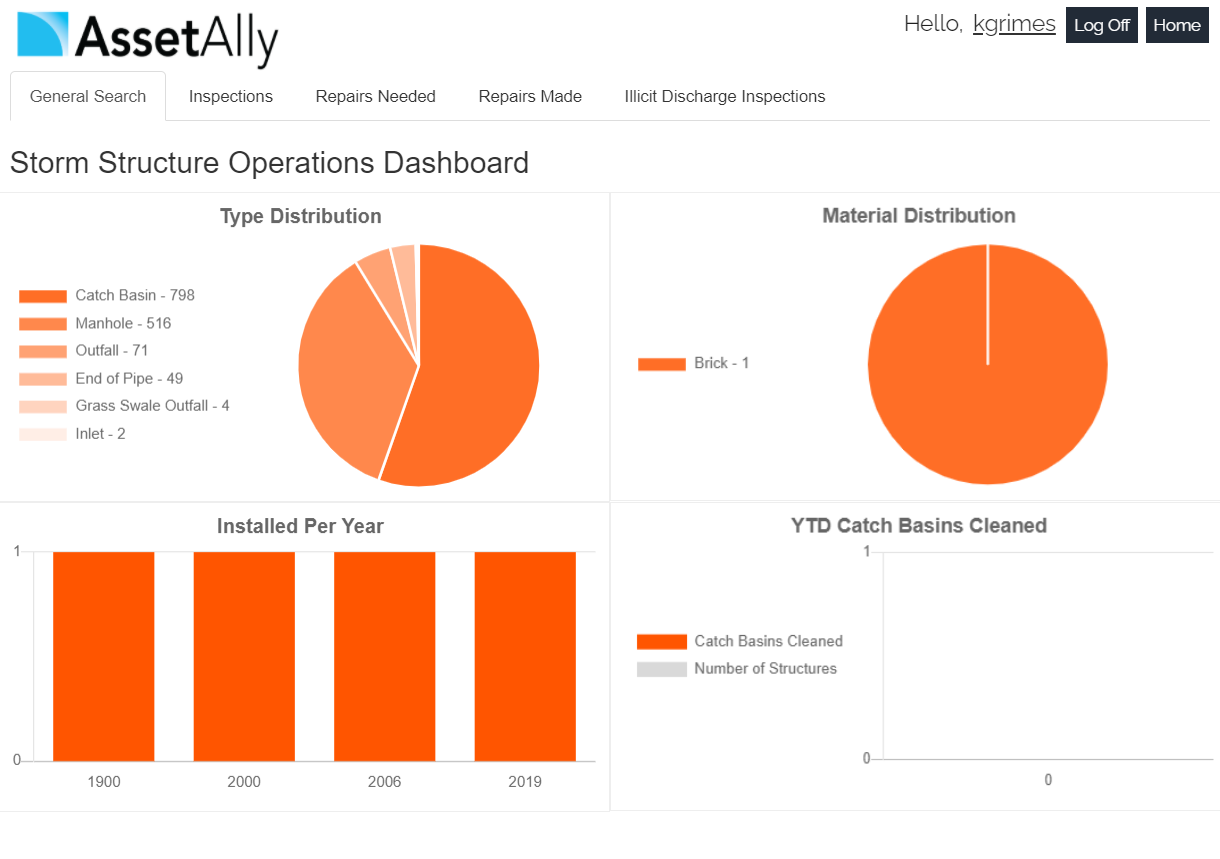
AssetAlly now includes new Operations Dashboards that give you an instant graphic overview of important community data like your team’s current workload, annual routine maintenance progress, and other essential infrastructure statistics.
You and your team spend a significant amount of time setting goals, navigating schedules, and documenting data to keep your municipality running. The Operations Dashboards allow you to instantly visualize those efforts without running lengthy queries or exporting your data into another program. Each dashboard is dynamic, so you don’t have to worry about updating charts to match your most current available data. Less time crunching numbers = more time improving your community.
Here are just a few of the many ways Operations Dashboard can improve your team’s processes.
Track Routine Maintenance Activities
The Operations Dashboards provide valuable insight into your annual routine maintenance activities, including hydrant flushing, storm water pond inspections, valve exorcising, manhole inspections, and more.
View Open Work Orders
With Operations Dashboards, you can now access an at-a-glance, updated view of your team’s top open work orders, as well as your current workload distribution by category and by staff member. This data can help you quickly and efficiently manage your team’s schedules, allowing you to hit your goals on-time.
Visualize Asset Statistics
Operations Dashboards also provide a quick overview of important community statistics, including:
Historical economic trends of community infrastructure (such as “year installed” for any asset)
Infrastructure quantities (i.e. number of pipes by material (lead laterals), number of pipes by total size in length, number of storm water ponds and BMPs in your community, and more)
Number of yearly inspections of community structures
Forrest diversity and health numbers (i.e. top 30 tree species, number of trees planted per year, and tree disease treatment data)
Learn More
To learn more about how Operations Dashboards can help your community maximize the value of its data, please contact one of our experts today!
