

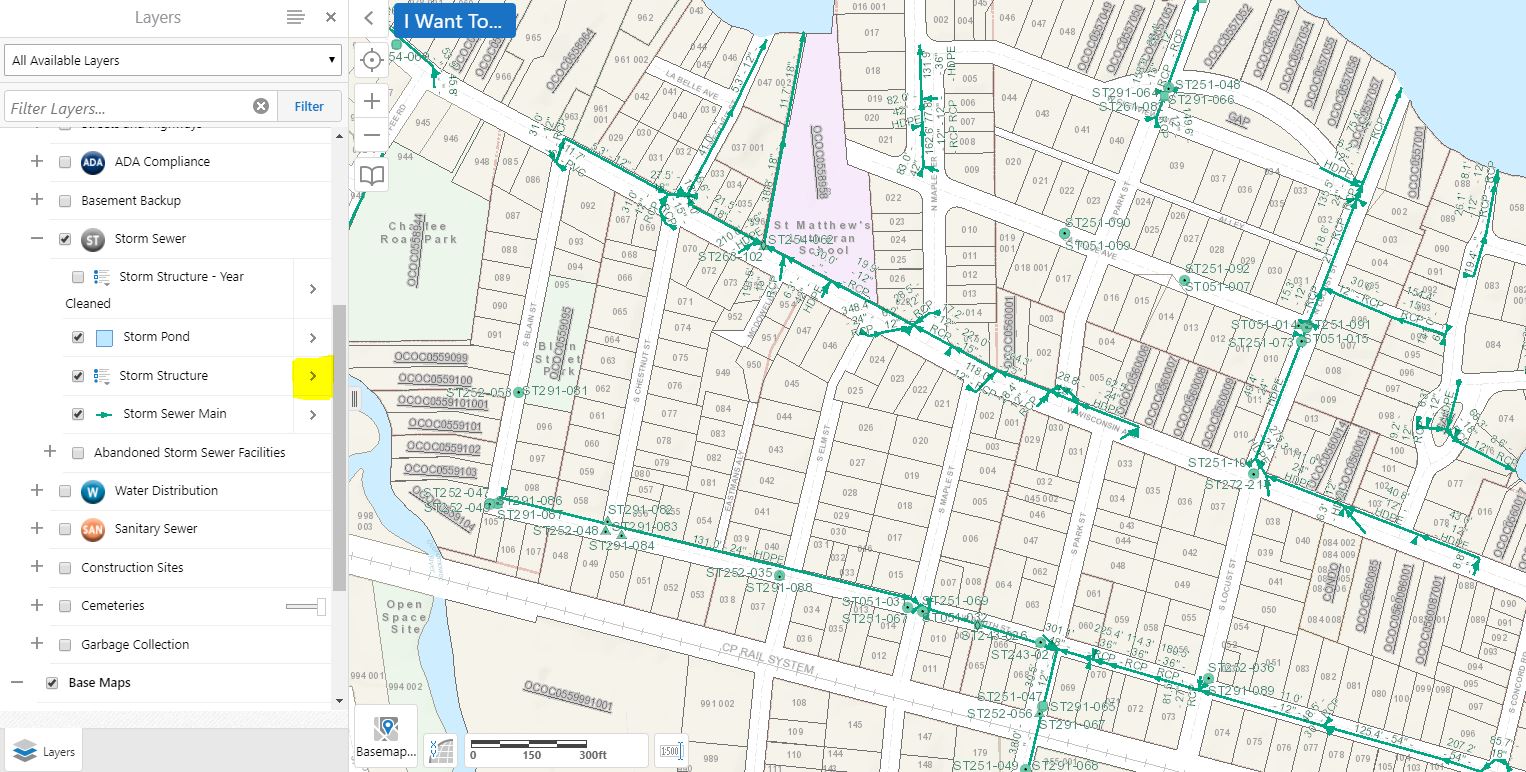
In this article we will discuss how to change symbology, color, size, etc. for structures in your GIS! Posted below, you can see that we have our storm layer turned on. In order to begin our edits, we click on the arrow (highlighted) next to "Storm Structure."
This takes us to a list of options to choose from. For this particular instance, we will click on "Turn on'off layer visualizations."

Next, we will pick "Custom Layer Style" from the dropdown.

"Symbology Type" options include "Simple," "Attribute," or "Image." For this example we will select "Attribute" and symbolize by storm structure type.

As you may notice in the image below, we can adjust the visualization of each set of storm structures individually by simply clicking on the structures name in the layer list.

The following image is not exactly beautiful, but we hope it gives you a good idea of the various ways in which you are able to personalize your GIS!

If you would like your edits to appear the same the next time you enter your GIS, be sure to save your work as a project before closing the browser!
Thank you as always for stopping by!
