


If you are interested in looking at information in an area within your GIS application, then you are probably familiar with the "identify" tool.
You may also be familiar with the typically long list of features that show up in the "Identify Results" viewer, even if only selecting a small section on your map. Of course, this list will be smaller depending upon how many layers you have turned on.
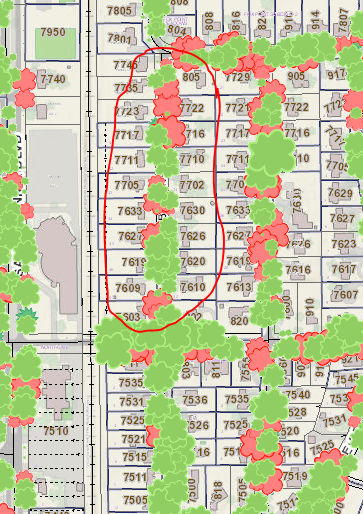
In this example, we will be identifying the items within the general area circled in the picture below.
The "Identify Results" list from the selection will end up looking something like this:
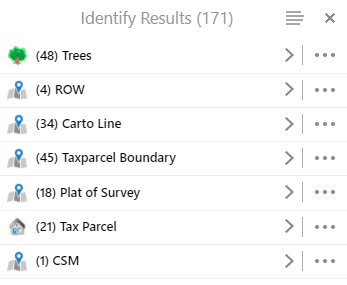
It is obviously quite helpful that all results are organized by layer now. However, sometimes it may still be somewhat of a hassle to run through a list view of a layer because there is still quite a bit of features within.
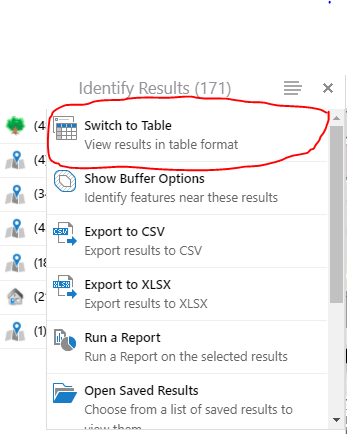
If you are looking for a more organized view of your data, you may like the "Switch to Tables" option. You can make your way to the table view by clicking on the hamburger list next to "Identify Results." The drop-down list offers various ways in which you can store, organize, and maintain your current selection, but we will just focus on the table view today.
When you select switch to table, it will look like the image below. Notice that even in the table format, the highlighting feature is still active! The selected result in the table correlates with the item in the map viewer.
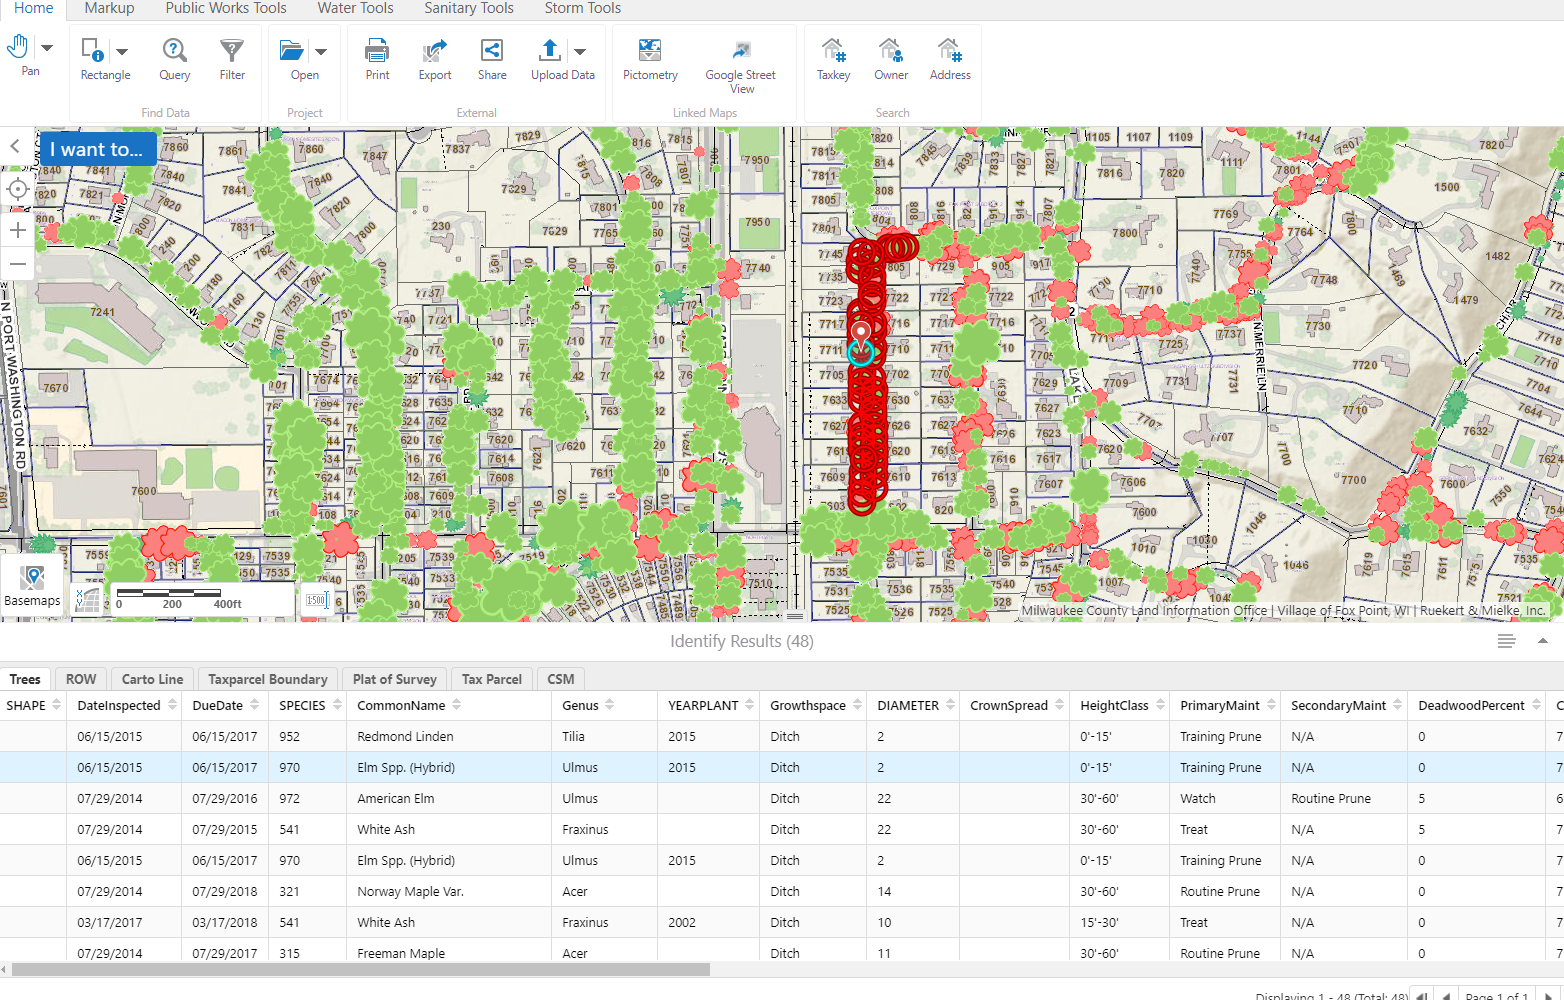
The "Switch to Table" option separates each selected layer (and the results within the layer) into their own individual tabs. You can also order your results for a layer from ascending to descending or vice versa. For example, if you are looking for only a particular genus of tree, you simply click on the category (genus) at the top of the table and all results will be ordered alphabetically.

You may also maximize or restore a table to the previous size by clicking on the arrow located on the top right-hand side.

